IJCRR - 4(14), July, 2012
Pages: 11-18
Date of Publication: 31-Jul-2012
Print Article
Download XML Download PDF
THE EFFECTS OF DEFICIT IRRIGATION ON THE GROWTH AND YIELD OF ONION
Author: J. D. Owusu-Sekyere, Samuel A. Manu
Category: General Sciences
Abstract:This study was conducted to determine the effects of deficit irrigation on the growth and yield of onion plants under a rain shelter. The completely randomized design was used with four treatment and three replications. The irrigation treatments imposed were application of 100% crop water requirement (ETc) \? T1, 80% ETc -T2, 60% ETc -T3and 40% ETc -T4. Growth parameters determined were bulb size and bulb weight. Uptake of nutrients, NPK, was also considered. The results showed that for both bulb size and weight, growth was in the order T2>T1>T3>T4. No clear pattern was observed in terms of nutrient utilization. It can be concluded from this study that reduction in the daily water requirement by 20% for onion plant will lead to greater yield.
Keywords: onion, water levels, deficit irrigation, growth, yield
Full Text:
INTRODUCTION
According to Kemp (1996), in Mediterranean countries, ?the world bank argues that the allocation of water to agriculture, which accounts for about 90% of regional water use no longer makes economic sense. In Morocco, for example, it is estimated that the value added by a cubic meter of water in irrigated agriculture is mere 15 cents; used in industry is a striking $25. In Jordan, which uses highly efficient drip irrigation for over half of its irrigated agriculture, the equivalent figures are 30 cents for agriculture and $15 for industry.? Therefore, there is an urgent need to maximize crop yields under conditions of limited water supply. Kang et al (2001) have shown that regulated deficit irrigation at certain periods during maize growth saved water while maintaining yield. Onion (Allium cepa L.) is one of the oldest vegetables known to man and a major vegetable crop in West Africa (Norman,1992). It is originated from the regions covering the Near East and Central Asia. It was introduced to Ghana from Burkina Faso and Northern Nigeria. According to Adomako (2007), the popular cultivar, Bawku Red was introduced into Ghana around 1930 and first grown in Bugri, near Bawku. In 1995, onion and shallot production in the country was 29,000 tonnes covering an area of 1,970 hectares (Vordzeorgbe, 1997). Present world production is about 46.7 million tonnes of bulbs from 2.7 million hectares (FAOSTAT, 2001). One major setback in vegetable production in Ghana, that is, onion and leafy vegetables, is the inability of farmers to determine correct amount of water required by the crop and adoption to the necessary irrigation practices during the growing season so as to maximize profit (Owusu-Sekyere, 2010). This usually results in water stress which directly affects crop growth and yield. Deficit irrigation is a practice of reducing the amount of water supplied to a crop or reducing the frequency of application and this could be one of the best tools to use to ensure optimum yield in times of drought. According to Kirda et al. (2002), deficit irrigation is a strategy that allows a crop to sustain some degree of water deficit in order to reduce costs and potentially increase income. It can lead to increase net income where water costs are high or where water supplies are limited. As a result of this, the study was conducted to determine the effects of applying different levels of water on the growth and yield of onion plants.
MATERIALS AND METHOD
Study Area
The study area was the School of Agriculture Teaching and Research Farm at the University of Cape Coast. Cape Coast Vegetation cover is made up of shrub. The soil type as classified by Asamoah (1973) is a sandy clayey loam of the Benya series, which is a member of the Edina Benya-Udu association. The study area experiences two rainy seasons namely the major season which starts from May and end in July and a minor season that starts around September and ends around mid November to give to the dry Harmattan season that runs through the end of March in the subsequent year. Mean annual temperature range for the day is 30 0 C-34 0 C and that of the night is 22 0 C-24 0 C with relative humidity between 75%-79%.
Experimental design and field layout
The Randomized Complete Block Design was used, with four treatments (T1-T4) and three replications, (R1-R3). Forty-eight (48) poly-bags were filled with sandy loam soil from the experimental site weighed on a scale to a weight of five (5) kilograms each after which they were placed under rain shelter where the research took place and replicated (100%-T1, 80%-T2, 60%-T3, 40%-T4). Six (6) boxes each measuring 1.0m x 0.95m giving a total area of 5.7m 2 divided into three (3) replications with each containing twelve (12) nursery bags were used. Planting Seeds of Red Creole were nursed on 20th October, 2009 and transplanted on 23rd November, 2009. The seedlings were hardened-off a weak before transplanting. Before transplanting, both nursery beds and all forty-eight poly bags were watered to make the seedlings able to withstand field conditions. The transplants were given equal amount of water 200ml each for seven days to ensure uniform recovery of all the transplants. The initial plant height at transplanting time was about 15cm.
Irrigation regime
An irrigation interval of two days was adopted and the amount of water to be applied each two-day interval was derived from the computed loss in weight of each set up over the two days. The equivalent in volume basis was found and applied to the plants as the various treatments demanded. The developmental , mid-season and late season stages lasted for 25days (23rd November – 17th December, 2009), 70days (17th December – 24th February, 2010) and 20days (24th February –16th March, 2010) respectively.
Treatments
The plants were subjected to different amounts of water after determining the crop water requirement per day. There were four (4) treatments (T1-T4) and three replications (R1-R3). There were 12 plants in all for each treatment represented by 4 plants for each replication. A total of 48 plants were considered. The amount of water to be applied for each growth stage was calculated using the following formulae:
Etc = Kc x ETo................................(1)
Where:
ETc = Crop Evapotranspiration
ETo = Reference
crop Evapotranspiration and
Kc = Crop co-efficient
Reference crop Evapotranspiration was also calculated or computed the formula (Allen et al. 1998)
ETo = Ep x Kp........................................ (2)
Where:
Ep = Pan Evaporation, that is depth of water lost from the evaporation pan
Kp = Pan co-efficient which is 0.7 (Allen et al., 1998).
ETc (2days) = Loss in weight of poly bags
ETc for a growth stage = 2 days
ETc x Growth period
Soil analysis
Soil samples were taken from nursery bags and were thoroughly mixed together. The samples were divided into four and two opposite quadrants were taken out. This was repeated and each time, another opposite quadrants was taken off until a substantial amount was obtained. The sample was then dried for four days after which it was grounded and then analyzed for the amount of nitrogen, phosphorous and potassium as well as moisture content and bulk density. This was done for the three growth stages considered. Other data collected a. Plant height: four plants were selected from each treatment replication and the heights were measured using a rule. b. Mean bulb weight: the number of bulbs per treatment was assembled and weighed using the electronic balance. The mean weight of each treatment plot was then computed by dividing the total weight by four. c. Mean bulb size: four bulbs of different sizes from each of the selected plants were assembled and transversely measured using a veneer caliper. The length across each of the selected bulbs was summed up and the mean bulb size was determined.
RESULTS AND DISCUSSION
The onion plants had a remarkable good start at the initial stage at the nursery for the first 35 days. At this stage, the difference in the parameters considered was not evident especially the plant height. However, the difference became evident as the plant entered the developmental, mid-season stage and the late-season stage. The plants had significant differences in the heights especially between control, T1 (100%) and T4 (40%) of the crop water requirement.Plants under T4 showed sign of dryness and wilting eventually leading to death unlike the counterpart T1which showed lavish growth and turgid tissues.

Comparing the mean plant heights at 5% probability level, there were highly significant difference between the various treatments at the developmental stage 25 DAT with T1 and T2 having closer values of 48.6cm and 46.1cm respectively, with T1 having the highest height followed by T2. There exists highly significant difference between T3 and T4 with T4 recording the lowest height among the four treatments at 39cm. At the mid-season stage 70 DAT; there was no significant difference between the plant heightsfor T1 and T2. However, there were significant differences between T1, T3 and T4. T4 recorded the lowest height at 58.1cm which is not significantly different from T3 of plant height 59.7cm. At the late season stage20 DAT; no significant difference existed among the imposed treatments (T1-T4) even though their mean plant height recorded was T1 60.9cm, T2 60.6cm, T3 58.9cm and T4 56.9cm. The highest plant height obtained from the imposed treatment T1 confirms William et al.(1991) studies that plant height increases with increasing amounts of water application. The significant difference in plant heights attained by T1 and T4 for the various growth stages indicates the importance of water to plants.
Also, the significant difference in plant heights among treatments may be due to the increased water use at the latter growth stages of the plants (Allen et al., 1998). The plant grows with increasing water use since leaf area, vegetative biomass, rate of respiration and root development and dispersion increases. Therefore it was very vital to make amends in order not for the plants to reduce or halt its metabolism rates. On the contrary, if this was not done, the rate of growth and development would have drastically be decreased, if the availability of soil moisture becomes a limiting factor then the extent of transpiration is expected to decrease as a physiological mechanism to sustain the plant in times of low moisture and subsequently decrease in growth and development. This however could be the reason for treatment four (T4) showing reduced vegetative growth.
Mean bulb size
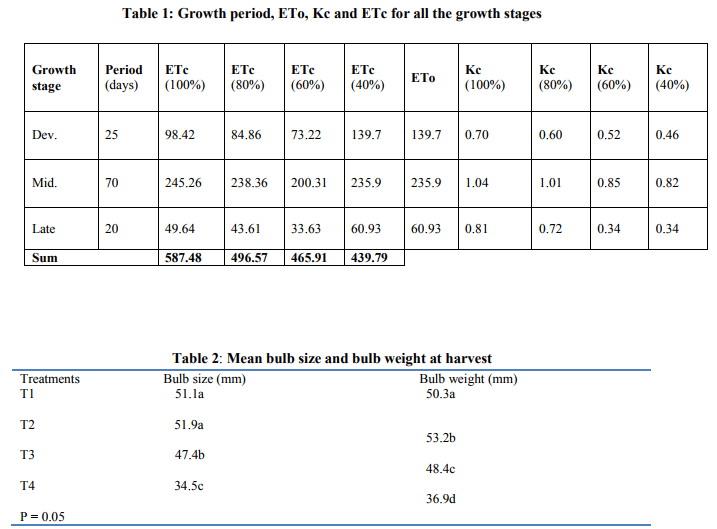
Several investigations have reported on the sensitivity of onion growth and yield to water stress ( Shock, 1999, and Goltz, 1971). Results obtained for the mean fruit sizes indicate significant differences among the treatments. However, there were no significant difference between T2 which recorded 51.9mm and T1 which recorded 51.1mm but significantly different from T3 and T4. These results seemed to be in disagreement with those reported by several investigators (Rana and Sharma, 1994) since T2 rather had a higher bulb size than T1. The total yield response to high amounts of total water application could be attributed to the enhancing effects of water to crop‘s biological functions and growth in addition to the improving effects of water on nutrients availability. Mean bulb weight The mean bulb weights obtained for the treatments imposed indicates significant difference among them. T2 had the highest bulb weight of 53.2g which was significantly different from that of T1, T3 and T4 with 50.3g, 48.4g and 36.9g mean bulb weight respectively. According to Shock et al. (1999), increase in total yield, marketable yield and profit of onion are obtained with increasing frequency of irrigation. However, the use of T2 rather resulted in higher bulb weight than T1 treatment imposed.
NPK levels
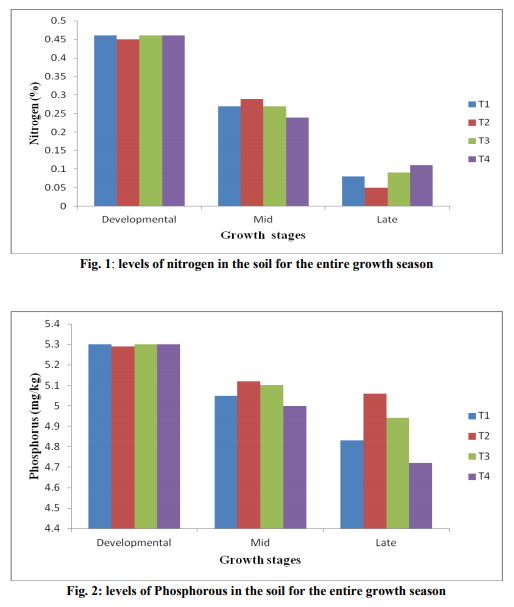
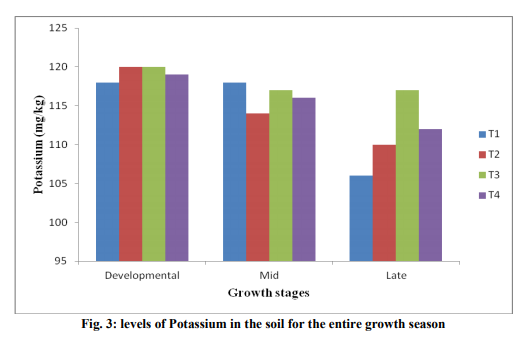
Soil NPK levels for the developmental, midseason as well as the late season are shown in Figures 1, 2 and 3. The uptake of nutrients such as nitrogen, phosphorus and potassium by plants are influenced by the amount of water available in the soil. Shapiro et al. (1956) indicated that translocation of phosphorus increases when there is improvement in aeration. The results obtained from the study indicates that T3 utilized the most N, where as T2 the most P. With regards to K, utilization was greatest under T3.


CONCLUSION
Results realized from the study have shown that water plays a very important role in the growth and yield of onion plants. Reduced water levels have a relatively detrimental effect on the development, yield and plant survival depending on the extent and magnitude of the water deficit. The study has also shown that reducing the daily water requirement by 20% will rather have remarkable yield even higher than the 100% daily crop water requirements. Thus a deliberate reduction in crop water requirement as a way of saving cost on irrigation should greatly be encouraged.
ACKNOWLEDGEMENT
We are most grateful to the Department of Agricultural Engineering, School of Agriculture, (University of Cape Coast) for their financial support. We also sincerely appreciate Mr. J. Dadzie, Mr. K. Conduah and Mr. Stephen Adu for their assistance during the experiments. Authors acknowledge the immense help received from the scholars whose articles are cited and included in references of this manuscript. The authors are also grateful to authors / editors /publishers of all those articles, journals and books from where the literature for this article has been reviewed and discussed.
References:
1. Allen, G. R., Pereira, S. L., Raes, D. & Smith, M. (1998). Crop Evapotranspiration. Guidelines for computing crop water requirement FAO Irrigation and drainage paper 56, Rome.
2. Asamoah, G. K. (1973). Soils of the proposed farm site of the University of Cape Coast. Soil Research Institute (C.S.I.R) Technical Report No.88.
3. Goltz, S.M., Tanner, C.B., Millar, A.A. and Lang, A.R.G. (1971). Water Balance of a Seed Onion Field. .Agron. J. 63, 762-765.
4. Kang S., Zhang L., Hu X., Li Z. and Jerie P. (2001. An improved Water Use Efficiency for Hot Pepper grown under controlled alternate drip irrigation on partial roots. Scientia Horticulture. 89: 257-267.
5. Kemp, P. (1996). New war of words over scarce water. Middle East Economic Digest 49: 2-7.
6. Kirda C., Moutonnet P., Hera C. and Nielsen D.R. (2002). Crop yield response to deficit irrigation. Dordrecht, the Netherlands, Kluwer Academic Publishers.
7. Norman, J. C. (1992). Tropical vegetable crops. Devon: Arthur Stockwell Ltd.
8. Owusu-Sekyere, J. D., Asante, P.and OseiBonsu, P. (2010). Water Requirement, Deficit Irrigation and Crop Coefficient of Hot Pepper (Capsicum Frutescens) using Irrigation Interval of Four (4) Days. ARPN Journal of Agricultural and Biological Science. Vol. 5, No. 5,
9. Rana, D.S. and Sharma, R.P. (1994).Effect of Irrigation Regime and Nitrogen Fertilization on Bulb Yield and Water use of Onion (allium cepa L.). Ind. J. Agr. Sci. 64, No.4, 223-226.
10. Shapiro R. E., Taylor G. S. and Volk G. W. (1956). Soil Oxygen Contents and Ion Uptake by Corn. Soil Sci. Soc. Amer. Proc. 20: 193-197
11. Shock, C.C., Jensen, L.B., Hobson, J.H., Seddigh, M., Shock, B.M., Saunders, L.D. and Stieber, T.D. (1999). Improving Onion Yield Market Grade by Mechanical Straw Application to Irrigation Furrows. Hort Technology, 9, No. 2, 1-7.
|


 This work is licensed under a Creative Commons Attribution-NonCommercial 4.0 International License