IJCRR - 4(19), October, 2012
Pages: 53-61
Date of Publication: 15-Oct-2012
Print Article
Download XML Download PDF
STUDIES ON GROWTH, MORPHOLOGY, SPECTRAL AND MECHANICAL PROPERTIES OF SOME DOPED L-ALANINE FAMILY OF SINGLE CRYSTALS
Author: K. Seethalakshmi, S. Perumal, P. Selvarajan
Category: General Sciences
Abstract:Single crystals of L-alanine (LA), L-alanine doped with potassium chloride (LAPC) and L- alanine doped with potassium bromide (LAPB) have been grown from solution by slow evaporation technique at ambient temperature. The effects of dopants in the host L-alanine crystals have been investigated from growth, morphology, spectral and mechanical properties. Scanning Electron Microscopic (SEM) analysis was used to compare morphology of the grown crystals. The functional groups of the samples were identified by FTIR spectral analysis. The hardness of the crystals was found out by Vickers microhardness tester.
Keywords: Characterization, Slow Evaporation, Single Crystal, SEM analysis, Vickers microhardness test.
Full Text:
INTRODUCTION
The present fascinating field of research is to synthesize, grow and characterize semi-organic Nonlinear Optical (NLO) crystals. The semiorganic crystals possess both the good qualities of host organic materials and additive inorganic materials [1]. This semi-organic NLO materials have been attracting great attention due to high non-linearity, chemical flexibility, high mechanical and thermal stability and good transmittance [2]. The amino acids exhibit specific features on interest such as (i) molecular chirality, which secures non-centrosymmetric crystallographic structure, (ii) absence of strongly conjugated bonds, which leads to wide transparency ranges in the visible and ultra-violet spectral regions and (iii) zwitter ionic nature of the molecule, which favours crystal hardness for applications in devices [3,4]. The α-carbon atom of L-alanine is bound with a methyl group making it one of the simplest α-amino acids with respect to molecular structure and also resulting in L-alanine being classified as an aliphatic amino-acid. The methyl group of L-alanine is non-reactive and is thus almost never directly involved in protein function [5]. The presence of dopants in small amount may greatly influence the crystallization kinetics of organic compounds from solution. A dopant may affect the activity of the crystallizing solute in solution and interface with the crystal growth process through adsorption onto the growing surface. It has been reported that doping NLO crystals with organic impurities can alter various physical and chemical properties and doped NLO crystals can be used for various applications. It is identified that adding dopants changes the properties of the crystals [6]. Hence the aim of this paper is to report the studies on growth morphology, spectral analysis and microhardness of some doped L-alanine crystals.
Growth of sample crystals
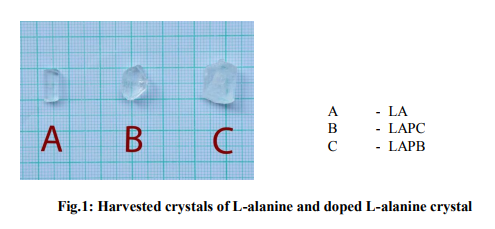
AR grade L-alanine was purchased commercially and single crystals of L-alanine were grown by saturating 20 g in doubly distilled water and allowing the solution by slow evaporation. 5 mole% of potassium chloride and potassium bromide were added separately into the solutions of L-alanine in two beakers and thoroughly dissolved in water by stirring well for about one hour using a magnetic stirrer simultaneously heating below an optimum temperature of 60 ?C, to get homogenous solution. The saturated solution was filtered using 4 micro Whatmann filter paper. Then the filtered solution was taken in a beaker and covered by a perforated cover for controlled of evaporation [7]. The variation in crystal configuration was observed right from its growth. The pure L-alanine (LA) crystal appears transparent and grows in size of 10?4?2 mm3 within 15 days, whereas L-alanine doped with potassium chloride (LAPC) and L-alanine doped with potassium bromide (LAPB) are semitransparent crystals and they grow in size of 10 ? 4 ? 2.5 mm3 and 12 ? 10 ? 3 mm3 between 20 – 25 days. The harvested crystals are shown in figure 1.
Instrumentation
In the present investigation, Scanning Electron Microscope (SEM) of model Jeol 5600 was used to study the surface morphology of the grown crystals. The samples of SEM are coated with a very thin layer of gold in a sputter coater to provide electrical conduction and there by reduce dry charging effects. The current magnification and accelerating voltage are digitally displayed with light emitting diodes. Grown crystals were subjected to Fourier Transform Infrared (FTIR) spectral studies using a Perkin – Elmer Spectrum FTIR Spectrophotometer, equipped with a KBr beam splitter and an air-cooled DTGS (Deuterated Triglycine Sulfate). In this method, 5 mg of sample crystal was mixed with 100 mg of dried KBr and subjected to pressure of 5?106 Pa and made into a clear pellet of 13 mm diameter and 1 mm thickness. The measurement of microhardness gives idea of mechanical strength of crystals and Vickers microhardness testing was carried out using the instrument named ‘CLEMAX’. Indentations were made for various loads from 25 g to 100 g. Several trials of indentations were carried out and the average diagonal lengths were measured for an indentation time of 15 s. The Vickers microhardness number was calculated using the relation, Hv = 1.8544 P/d2 kg/mm2 where P is the applied load and d is the diagonal length of the indentation [8,9].
RESULTS AND DISCUSSIONS
Scanning Electron Microscope (SEM) Analysis In SEM, the surface of solid sample is scanned in a raster pattern with a beam of energetic electrons.
The back scattered and secondary electrons produced from the surface by the interaction of the primary electron beam with loosely bound electrons of the surface atoms serve as the basis of SEM. When the electron beam scans the specimen surface, there will be a change in the secondary electron emission according to the surface texture. The SEM images of the crystals of pure Lalanine, L-alanine doped with potassium chloride (LAPC) and L-alanine doped with potassium bromide (LAPB) are presented in the figures 2 (a,b), 3(a,b) and 4(a,b).
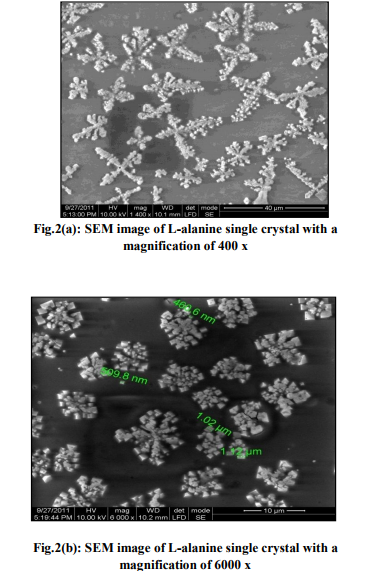

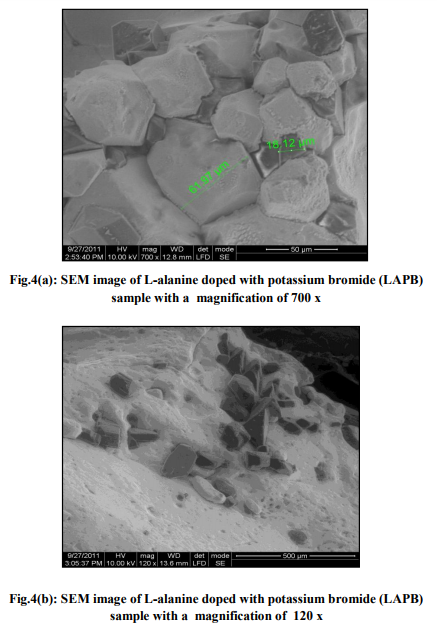
Figs. 2(a) and 2(b) show the SEM images of Lalanine crystal at different magnifications and the anisotropic formation of flower shaped morphology in different directions are noticed. It is observed that there is a very densely packed granular structure with lack of distinct grain boundaries in the crystal [10]. The surface features of LAPC crystal at different magnifications are presented in the figures 3(a) and 3(b). Fig.3(a) shows the heart shaped and many rectancular shaped voids of irregular dimension indicating that this compound has high inter-granular porosity. Fig.3(b) shows the SEM image of LAPC at a magnification of 2000 x and it gives many rectangular shaped voids. The SEM images of LAPB sample are presented in the figures 4(a) and 4(b) and in these images there are large sized, rectangular shaped voids comparing to the SEM images of LAPC sample and it is noticed that there are lazy and lumpy bigger structures dispersed in the matrix of fine grained crystallites. SEM images show a remarkable changes in the morphology between doped and undoped crystals. FTIR Spectral analysis The infrared spectroscopy is the powerful and potential analytical tool in the analysis of compounds and molecules. The interaction of molecules with electro – magnetic waves forms is the main concept of IR spectroscopy. For a molecule to absorb IR radiations, the vibrations or rotations within a molecule must cause a net change in the dipole moment of the molecule [11]. FTIR spectra of pure L-alanine, LAPC and LAPB samples are shown in figures 5, 6 and 7 respectively.
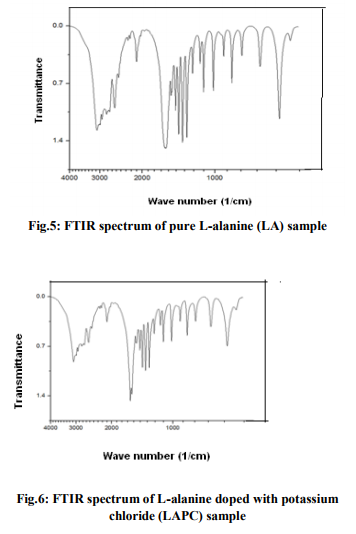
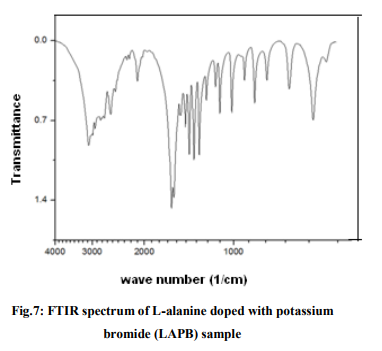
For pure L-alanine crystals the absorption peaks (Fig.5) at 3085, 1621 and 1518 cm-1 are the indication of the presence of ? NH3 group in the crystal. The peaks at 2994, 2850, 2600 cm-1 are attributed to the C-H stretching mode vibrations. The peaks at 1590 cm1 has a strong C=O stretching, at 1455 cm-1 it shows COOsymmetric stretching, wave numbers 1306, 919 and 649 show C-H bending. The O-CO bending mode at 772 cm-1 has been identified and assigned and at 849 cm-1 , a strong C-H wagging and twisting is identified. For LAPC crystals, the absorption peaks (Fig.6) at 3079, 3020, 3000 cm-1 are the indication of the presence of ? NH3 group in the crystal. The peaks at 2988, 2603, 2322 cm-1 are attributed to the C-H stretching mode vibrations, at 1594 cm-1 a very strong asymmetric deformation of ? NH3 is identified, at 1455 cm-1 , a strong COOsymmetric stretching is observed, at 1307 cm-1 , CH2 wagging is seen and a very strong aliphatic C-Cl absorption is identified and assigned at 850 cm-1 . For LAPB crystals, the absorption peaks (Fig.7) at 3066, 3033, 3020 cm-1 are the indication of the presence of ? NH3 symmetric stretching because of hydrogen bonding in the crystal. The peaks at 2591, 2314, 2293 cm-1 are attributed to the C-H stretching mode vibrations, at 1518 cm-1 it shows C=O stretching and at 1455 cm-1 a strong COOsymmetric stretching is identified, at 1307 cm-1 CH2 wagging is observed, at 850 cm-1 wagging and twisting is noted, C – Br stretch is seen at 649 cm-1 and COOrocking is observed in 544 cm-1 . Thus, adding dopants into L-alanine crystal shows variations in the infrared spectra, especially at 850 cm-1 in case of LAPC and 649 cm-1 in case of LAPB. Similar features of bands are observed at 2113 cm-1 for pure L-alanine and 2112 cm-1 for LAPC and 2111 cm-1 for LAPB and this is an overtone region with a combination of a symmetrical ? NH3 bending vibrations and torsional oscillations. The assignments for the absorption peaks of the FTIR spectra have been given in accordance with the data reported in the literature [12].
Microhardness studies
The hardness of a material is a measure of its resistance to plastic deformation. This deformation can be achieved by indentation, bending, cutting or scratching. Here all the three crystals were subjected to Vickers microhardness test with a load varying from 25 g to 100 g [13,14]. Vickers microhardness profile as a function of the applied test loads were illustrated in the figure 8. It is clear from results that the micro – hardness of the crystal decreases with increasing in the load, also the microhardness number decreases when Lalanine crystal is added dopants like potassium chloride and potassium bromide. The value of the work hardening coefficient ‘n’ was estimated from the graph of log P versus log d drawn by least square fit method, shown in figure 9. The value of the work hardening coefficient ‘n’ is found to be 1.733 for pure L-alanine and 2.7808 for LAPC and 1.833 for LAPB. According to Onitsch, 1.0 ? n ? 1.6 for hard materials and n > 1.6 for soft materials [15]. Hence it is concluded that all the three crystals LA, LAPC and LAPB belong to the category of soft materials.

CONCLUSION
Single crystals of some L-alanine family have been grown by solution method using waster as solvent. Transparent and semi-transparent crystals of well-defined morphologies were obtained. From SEM analysis, it is concluded that there is a formation of voids of different shapes on the surface of the grown crystals. FTIR spectral analysis confirmed the presence of functional groups in the crystals. From Vickers microhardness test, it is found that hardness number decreases with increasing load and it is concluded that the grown crystals of this work belong to the category of soft materials.
ACKNOWLEDGEMENT
The authors would like to thank Prof. Surapaneni Krishna Mohan, Dept of Bio-chemistry, Saveetha Medical College, Chennai for his extended support and encouragement.
References:
1. J. Ramajothi, S. Dhanuskodi, Spectrochimica Acta Part A 68 (2007) 1213.
2. Min – hua Jiang , Qi Fang, Adv. Mater. 11(1999) 1147.
3. J.F. Nicoud and R.J. Twieg (Eds). In Nonlinear optical properties of organic molecules and crystals. 1(1987) 277.
4. K.D. Parikh, D.J. Dave, B.B. Parekh and M.J. Joshi, Cryst Res. Technology 45 (2010) 603.
5. D. Prabha and S. Palaniswamy. International Journal of chemical, Environmental and Pharmaceutical Research. 1 (2010) 40.
6. David Lechuga – Ballesteros and Nair Rodriguez – Hornedo, Pharmaceutical Research, Vol 10 (1993) 7.
7. A.S.J. Lucia Rose, P. Selvarajan, S. Perumal, Recent Research in Science and Technology. 3 (2010) 76.
8. W. Shockley and W.T. Read, Physical Review. 78(1950) 275.
9. P. Selvarajan, J. Glorium Arulraj. S. Perumal, J. Crystal Growth. 311(2009) 3835.
10. Palaniswamy S, Bala Sundaram, O.N, Rasayan. J. Chem. 2(2009) 28.
11. G. Sankari, T.S. Aishwarya, S. Gunasekaran. Recent Research in Science and Technology 11 (2010) 20.
12. G. Socrates, Infrared and Rama Characteristic Group Frequencies, 3rd Ed. Wiley. New York (2001).
13. Ambujam, S. Selva Kumar, D. Prem Anand, G. Mohamed and P. Sagayaraj. Cryst. Res. Technol. 41 (2006) 671.
14. M. Vimalan. A. Ramanand and P. Sagayaraj. Cryst.Res.Technol. 42 (2007) 1091.
15. E.M. Onitsch, Mikroscopia 2(1947)131
|
 IJCRR
IJCRR 


 This work is licensed under a Creative Commons Attribution-NonCommercial 4.0 International License


