 IJCRR
IJCRR International Journal of Current Research and Review
Welcome to IJCRR
Indexed and Abstracted in: Crossref, CAS Abstracts, Publons, Google Scholar, Open J-Gate, ROAD, Indian Citation Index (ICI), ResearchGATE, Ulrich's Periodicals Directory, WorldCat (World's largest network of library content and services)
|
1 Eu01 |
59.9NH4H2PO4-10LiF-10SrO-20ZnO-0.1Eu2O3 |
|
2 Eu05 |
59.5NH4H2PO4-10LiF-10SrO-20ZnO-0.5Eu2O3 |
|
3 Eu10 |
59.0NH4H2PO4-10LiF-10SrO-20ZnO-1.0Eu2O3 |
|
4 Eu15 |
58.5NH4H2PO4-10LiF-10SrO-20ZnO-1.5Eu2O3 |
|
5 Eu20 |
58.0NH4H2PO4-10LiF-10SrO-20ZnO-2.0Eu2O3 |
|
6 Eu30 |
57.0NH4H2PO4-10LiF-10SrO-20ZnO-3.0Eu2O3 |
Precise amounts of the starting materials in mol% were weighed out and grinded in an agate mortar. The mixtures were placed in porcelain crucibles and were then heated in an electric furnace. After heating, the obtained liquid was poured on brass plate and then pressed by another brass plate. The obtained glasses are used for measurements.
DTA measurement was performed using a NetZsch STA 409 model with N2 atmosphere. Amorphous nature of prepared glasses was verified by SEIFERT X-RAY diffractrometer. FTIR spectrum was recorded using a series of Perkin Elmer spectrum One FT-IR spectrophotometer. Raman spectrum was recorded JOBIN YVUON spectrometer. The optical absorption spectral recording was done on ELICO SL 218 double beam spectrophotometer. The excitation, photoluminescence spectra and decay curves of Eu3+ doped glass samples were recorded using FLS-980 fluorescence spectrometer with xenon lamp as excitation source.
Results
Thermal analysis- Differential thermal analysis (DTA)
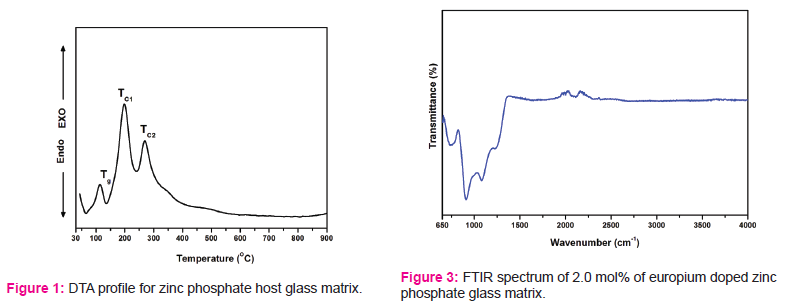
In order to understand and interpret the thermal, crystallization and melting behaviour of glass system, differential thermal analysis (DTA) is important one. Through DTA analysis, phase changes are also observed during thermal heat treatment. The separated various phases like glass transition temperature (Tg) and crystallization temperature (Tc) which are depend on the different constituting oxides such as glass former and modifiers in the glass systems. DTA profile is recorded for host ZP glass matrix and is presented in Fig.1.
XRD analysis
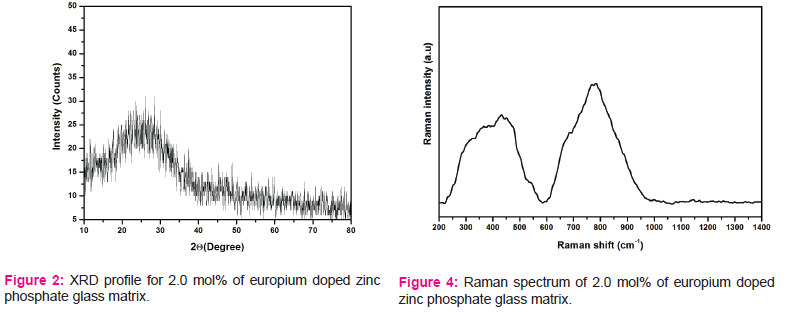
XRD profile of 2.0 mol% of europium doped zinc phosphate glass is pictured in Fig.2.
FTIR spectrum
Fig.3 shows FTIR spectrum of 2.0 mol% doped zinc phosphate glass matrix.The bands are observed at 740 cm-1, 910 cm-1, 1075 cm-1 and 1230 cm-1.
Raman spectrum
Fig.4 shows Raman spectrum of 2.0 mol% doped zinc phosphate glass matrix. The bands are observed between 300-480 cm-1 region and at 773 cm-1.
Optical absorption of Eu3+ doped ZP glasses
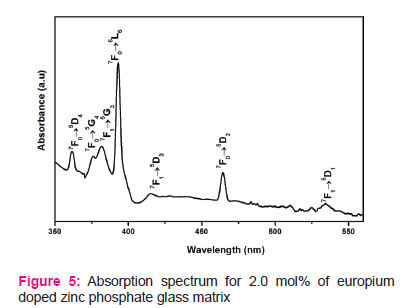
The optical changes of the Eu3+doped ZP glasses were observed through the absorption spectra and these measurements for all glasses were recorded and were shown in Fig. 5 for 2.0 mol% of Eu3+ doped glass matrix. The absorption spectra display seven transitions from the ground levels 7F0 and 7F1. The absorption spectral bands originate from 7F0 and 7F1 levels since these levels (7F0 and 7F1) are being closely located to each other.
Excitation and emission spectra of Eu3+ doped ZP glasses
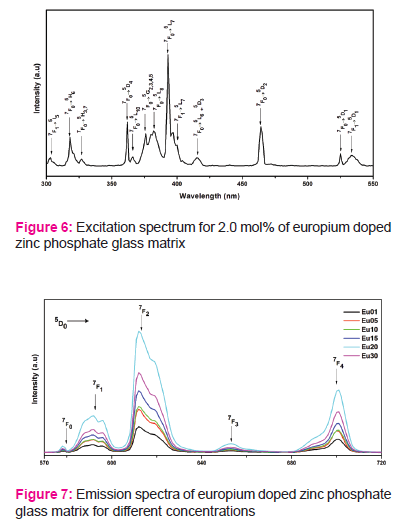
The observed excitation and emission spectra of Eu3+-doped ZP glasses were shown in Figs. 6 and 7 respectively. The observed excitation spectral transitions were found to be matched with the absorption transitions. In the excitation spectra, major emission intensity was observed at 393 nm due to 7FO→5L7 transition for all Eu3+-doped ZP glasses and using this as excitation source, emission spectra were recorded. Fig. 7 shows Eu3+ doped emission spectra for Eu01, Eu05, Eu10, Eu15, Eu20 and Eu30 glasses under ultraviolet excitation source (at 393 nm).
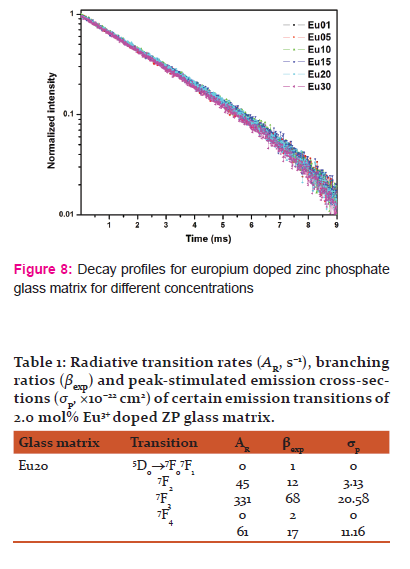
Decay analysis of Eu3+ doped ZP glasses
The emission decay time of the 5D0 level (at λexc = 393 nm and at λemi=612 nm) of the different ZP glasses are shown in Fig. 8. The decay curves were fitted to the first order exponential function for all Eu3+ doped ZP glasses.
Discussion
From Fig.1, an endothermic peak located nearly at 136 OC is observed which is due glass transition temperature (Tg). Two exothermic peaks follow after the glass transition temperature indicating the stage of crystallization (TC) process. TC1 and TC2 are two crystallization events are formed during melting process. These two events are occurred nearly at 196 and 267 OC temperatures, respectively. From Fig. 1, where the higher TC2 and lower Tg are used to measure the thermal stability of the amorphous zinc phosphate glass system. The thermal stability or glass forming ability can be measured by difference of glass transition and crystallization temperatures (ΔT = TC2-Tg) [10]. In the present work, it is observed that the thermal stability is found to be 131 OC which is high for the zinc phosphate glass system.
From this XRD figure 2, it is apparent that no characteristic diffraction peaks, indicating that the prepared glasses are of amorphous in nature. Fig.3 consists of the band at 740 cm-1 is ascribed to the symmetric stretching vibration of P–O–P rings. The absorption band at 910 cm-1 is related to asymmetric stretching vibration of P–O–P groups linked with linear metaphosphate chains. The band at 1075 cm-1 is assigned to asymmetric stretching of PO-2 group units. The band at 1230 cm-1 is attributed to the stretching of the doubly bonded oxygen vibration, νas(P = O) modes [11].
Fig.4 shows Raman spectrum consists of the broad band at 773 cm-1 is due to symmetric stretching of (P–O–P) bridging oxygen bonds in (P2O7)4 units. [12, 13, 14 ]. This peak is a convolution of two peaks i.e. one may due to vibrations of the two joined Q2 units and the second one to those of Q1 units. Presence of last two bands indicates that due to addition of different modifiers into glass matrix, long range order of network become cut down and formed chain like units. This type of structural units increases glass strength.
The absorption spectra (Fig.5) display seven transitions from the ground levels 7F0 and 7F1. The absorption spectral bands originate from 7F0 and 7F1 levels since these levels (7F0 and 7F1) are being closely located to each other. However, transitions from the 7F2 level were too weak to be investigated because of the minimum fractional thermal populations at room temperature [14]. The optical bands observed due to the 7F0→5D4, 7F0→5G4, 7F1→5G3, 7F0→5L6, 7F1→5D3, 7F0→5D2 and 7F1→5D1 transitions, centered at 362, 376, 382, 393, 415, 465 and 535 m respectively. At room temperature, energy difference between 7F1 and 7F0 level was only ~350 cm-1 and thermally populated about 35% and 65% respectively. Hence, absorption transitions were appeared from both levels [16]. So that, Judd-Ofelt analysis from the absorption spectra is very difficult. Out of these seven bands, the absorption band, 7F0→5L6 has more intensity than rest of the absorption bands. This transition was forbidden by the ΔS and ΔL selection rules, but it is allowed by the ΔJ selection rule. Furthermore, the intensity of 7F0→5D2 (electric dipole) transition has higher than that of 7F0→5D1 transition (magnetic dipole). Hence, the 7F0→5D2 transition is referred as hypersensitive transition [17,18].
The excitation spectra (at λemi= 611 nm) were composed of 7F1→5I5, 7F0→5H6, 7F0→5H3,7, 7F0→5D4, 7FO→5L10, 7F0→5G2,3,4,5, 7FO→5L7, 7F0→5L6, 7FO→5D3, 7FO→5D2, 7FO→5D1 and 7F1→5D1 transitions with the wavelengths located at 302, 319, 326, 360, 364, 376, 381, 393, 413, 463, 522 and 531 nm respectively (Fig.6). The 7F0→5L6 (393 nm) and 7F0→5D2 (464 nm) transitions indicate relatively higher intensities than the other transitions [19]. It is observed that the peak at 440 nm is associated to the pure electronic transition (PET) and the peak at 464 nm is associated to the phonon side band (PSB) 7F0→5D2 occur at higher energy side. Due to excitation by the incident energy corresponding to the PET with an excess energy of vibrational modes of Eu-O bonds, PSBs were occurring. The phonon energy (?ω) can be defined as energy difference between PSB (at 22727 cm−1) and PET (at 21555 cm−1), it was 1172 cm−1 in Eu3+ doped ZP glasses. Thus, PSBs result from inter mixing of vibrational modes to the IR bands in the range 1080-1270 cm-1 related to P-O-P and P=O bands. The electron–phonon coupling strength parameter (g) was calculated from the integrated intensity ratios of PSB to PET using the formula given in Ref. [20]. The g parameter gives intensity of interaction between Eu3+ cation and O2- ligand anion. This g parameter was found to be 0.1, 0.4, 0.5, 0.7 and 0.5 for Eu01, Eu05, Eu10, Eu15, Eu20 and Eu30 glass matrices respectively.
In the excitation spectra, major emission intensity was observed at 393 nm due to 7FO→5L7 transition for all Eu3+-doped ZP glasses and using this as excitation source, emission spectra (Fig.7)were recorded. By using 393 nm excitation, transitions from ground level to 5L7 level take place. The population of the 5L7 level relaxes non-radiatively (NR) to the 5D3 level, and then sequentially to the lower 5D0 level via 5D2 and 5D1 levels. Emissions from the 5D0 level to lower levels takes place radiatively due to higher energy gap between the excited 5D0 and 5F6 level and negligible multiphonon relaxation (MPR) effect. Emission occurs only from 5D0 level and emission from 5D1, 5D2 and 5D3 levels were not observed (From Fig.7) due to higher phonon energy of ZP host glass matrix. In the present work, five emission bands (in the visible region) were noticed i.e. from the excited state 5D0 to lower levels i.e. 5D0→7F0 (578 nm, yellow), 5D0→7F1 (590 nm, orange), 5D0→7F2 (611, red), 5D0→7F3 (653 nm, deep red), 5D0→7F4 (701 nm, deep red).
The emission line associated with 5D0→7F2 transition has the highest emission intensity and the emission line associated with 5D0→7F0 transition has the lowest in emission intensity. Out of five bands, the 5D0→7F2 band was a forced electric dipole (ED) allowed transition and it possesses hypersensitive character due to the admixture of odd-parity character into the 4f6 wave functions. Meanwhile, the 5D0→7F1 was magnetic dipole (MD) spin-forbidden transition but it is allowed when Eu3+ ion is in higher symmetric position due to spin–orbit interaction. The rest of emission lines 5D0→7FJ (J = 0 and 3) were strictly forbidden. The intensity ratio (R: ED/MD) was widely used to manifest the bonding medium and asymmetry around Eu3+ ions. This ratio gives information concern covalent/ionic bonding between the Eu3+ ions and the surrounding oxygen ligands. With increase in europium concentration, R value also increases due to increase in asymmetry and higher degree of covalency between Eu–O. Smaller values of R is attributed to higher local symmetry for Eu3+ ions.
Increase of Eu3+ content from 0.1 mol% to 2.0 mol% increases the emission intensities, and then decreases drastically when Eu3+ content is 3.0 mol%. As the concentration increased, the Eu3+ ions are crowded closer and closer together. This is owing to strong interactions among the europium ions as well as cross relaxation (CR) process at higher concentrations. These CR was from 5D2 to 5D1 levels and from 5D3 to 5D2 levels and channels like : 5D2+7F1→5D1+7F4 and 5D3+7F0→5D2+7F4. Among all ZP glasses, 2.0 mol% of Eu3+ doped ZP glass shows the strongest red emission intensity.
The limited level of absorption transitions and energy level structure of Eu3+ ion, Judd-Ofelt parameters were unable to determine from absorption spectra. Hence, the J-O intensity parameters (Ω2 and Ω4) [21, 22] were calculated for Eu20 ZP glass system from the emission spectra. The 5D0→7F2 transition has not been observed in emission spectra and hence Ω6 parameter was not evaluated. It is observed that the Ω2 parameter is high (7.11 × 10⁻²⁰ cm2) in 2.0 mol% Eu3+-doped ZP glass matrix. This indicates that high asymmetry and covalency connected around the europium ions in the Eu20 glass matrix. The J-O parameters followed with trend like Ω2>Ω4 in Eu20 ZP glass. This affirmation is also in consistence with the obtained R/O intensity ratios observed in Eu20 glass matrix. J-O intensity parameters were used to assess the radiative properties and are presented in Table 1 for Eu20 ZP glass matrix.
It is observed that among all emission transitions, 5D0→7F2 transition shows higher values of radiative transition probabilities (AR) in all the concentrations, and this value is high in 2.0 mol%. The experimental branching ratios (βexp) and stimulated emission cross-sections (σe) for all the emission transitions of Eu3+-doped ZP glass matrices are also calculated. The βexp are obtained from the relative areas under specific transitions. From Table 1, among all emission transitions, 5D0→7F2 transition has higher βexp (68%) for 2.0 mol% of Eu3+-doped Eu20 glass matrix. It indicates that the dominant red emission located at 612 nm of Eu3+ might be useful for optical materials. The luminescence performance of the material can be decided from σP values. From table 1, the σP values are higher for 5D0→7F2 transition compared to other emission transitions.
The obtained lifetimes (Fig.8) were 2.3, 2.3, 2.4, 2.5, 2.6, and 2.7 ms for Eu01, Eu05, Eu10, Eu15, Eu20 and Eu30 glasses respectively. Decay time is observed to be increased with increasing Eu3+ ion concentrations from 0.1 mol% to 2.0 mol % and then decreases. The glass sample with 0.1 mol% shows the shortest luminescence lifetimes and sample with 2.0 mol% shows the longest luminescence lifetimes.
Conclusion
The authors prepared and characterized Eu3+ doped zinc phosphate glasses for luminescence applications. The thermal stability measured by using DTA technique. In the present work, it is observed that the thermal stability is found to be 131 OC which is high for the zinc phosphate host glass system. The phase composition of the product was verified by X-ray diffraction analysis and found to be amorphous in nature. The structural properties are studied through FTIR and Raman measurements. Optical properties of Eu3+ in the studied zinc phosphate glasses were evaluated in the framework of Judd–Ofelt theory. Among different ZP glasses, Eu20 has high covalency bond. Red emission of Eu3+ is generated mainly by the 5D0→7F2 transition located at 612 nm. Concentration quenching and energy transfer were observed from fluorescence spectra and decay curves, respectively. The 0.1 mol% and 3.0 mol% Eu3+ doped ZP samples have the longest and shortest decay times. With the increase in dopant concentration, decay time values gradually decreased. It was found that the main reason for concentration quenching was non-radiative energy transfer through cross-relaxation mechanism due to dipole–dipole interaction. This approach shows significant promise for use in bright orange-red lighting applications. The optimized properties of the Eu3+ doped zinc phosphate glasses are found to be promising luminescent materials.
ACKNOWLEDGEMENTS
Authors acknowledge the immense help received from the scholars whose articles are cited and included in references of this manuscript. The authors are also grateful to authors / editors / publishers of all those articles, journals and books from where the literature for this article has been reviewed and discussed.
Source of funding: None
Conflicts of interest: None
References:
Indexed and Abstracted in


Antiplagiarism Policy: IJCRR strongly condemn and discourage practice of plagiarism. All received manuscripts have to pass through "Plagiarism Detection Software" test before forwarding for peer review. We consider "Plagiarism is a crime"
IJCRR Code of Conduct: To achieve a high standard of publication, we adopt Good Publishing Practices (updated in 2022) which are inspired by guidelines provided by Committee on Publication Ethics (COPE), Open Access Scholarly Publishers Association (OASPA) and International Committee of Medical Journal Editors (ICMJE)
Disclaimer: International Journal of Current Research and Review (IJCRR) provides platform for researchers to publish and discuss their original research and review work. IJCRR can not be held responsible for views, opinions and written statements of researchers published in this journal.
International Journal of Current Research and Review (IJCRR) provides platform for researchers to publish and discuss their original research and review work. IJCRR can not be held responsible for views, opinions and written statements of researchers published in this journal
148, IMSR Building, Ayurvedic Layout,
Near NIT Complex, Sakkardara,
Nagpur-24, Maharashtra State, India
editor@ijcrr.com
editor.ijcrr@gmail.com
 This work is licensed under a Creative Commons Attribution-NonCommercial 4.0 International License
Copyright © 2026 IJCRR. Specialized online journals by ubijournal


