IJCRR - 4(22), November, 2012
Pages: 115-121
Date of Publication: 24-Nov-2012
Print Article
Download XML Download PDF
NUTRIENT INTAKE OF OBESE ADOLESCENTS IN SELECTED DISTRICTS OF TAMIL NADU
Author: A. Ponni Syamala, Dorothy Jaganathan
Category: Healthcare
Abstract:Objective: To assess the nutrient intake of the obese adolescents in selected districts of Tamil Nadu. Material and Methods: The study was carried out among 6000 adolescents of 12\?17 years of age in five districts (Coimbatore, Madurai, Salem, Tiruchirappalli, and Tirunelveli) of Tamil Nadu. The dietary survey (weighed food record method) was conducted among 55 obese adolescents from each age group in five districts (Coimbatore, Madurai, Salem, Tiruchirappalli, and Tirunelveli) of Tamil Nadu. The intake of energy, other macronutrients, and micronutrients for individuals was calculated using the Nutritive value of Indian foods (ICMR, 2010) and compared with RDA. Results: Among 6000 adolescents, 23 percent were obese in Coimbatore while 17 percent in Madurai, 22 percent in Salem, 20 percent in Tiruchirappalli and 18 percent in Tirunelveli Districts. The nutrient intake of the selected adolescents except for iron exceeded the ICMR Recommended Dietary Allowances. The mean calorie intake was higher among adolescents of Coimbatore District (Boys- 2842\?54.9 kcal/day; Girls - 2503\?167.4 kcal/day) when compared to other districts. Conclusion: The study suggests that the nutrient intake of obese adolescents varies from each district remarkably with socioeconomic status, food consumption pattern and lifestyle habits. The nutrient intake of the selected adolescents exceeded the ICMR Recommended Dietary Allowances. It is concluded that proper nutrition is essential to keep teens healthy and able to grow and develop properly.
Keywords: Adolescent Obesity, Weighed Food Record, Nutrient Intake.
Full Text:
INTRODUCTION
Obesity is defined as an excess accumulation of body fat which is the result of a positive energy balance where caloric intake exceeds caloric expenditure. According to newly established national criteria, teens are at significant risk for becoming obese adults. Proper nutrition is essential to keep teens healthy and able to grow and develop properly. Healthy Eating help teens to participate better in school and athletic activities. There are also disturbing trends such as sedentary work, faulty dietary habits and stress causing activities that aggravates obesity, heart disease and diabetes particularly among adolescents. Socioeconomic status was inversely related to the prevalence of obesity, regardless of geographic region. Dietary habits in childhood will impact on growth, development and disease risk throughout life.1 Overweight and obesity are strongly associated with certain types of diets, such as those that include large amounts of fats, animal-based foods and processed foodstuffs.2 Sedentary lifestyles are also an important factor, including spending no time for outdoor sports and participating in little or no physical activity during leisure time.3 Physical inactivity plays an important role in the development of obesity. In a modern affluent society, energy sparing devices also reduce energy expenditure and enhance the tendency to become obese. Whereas the rising prevalence of obesity can be partly explained by environmental changes over the last 30 years, in particular the unlimited supply of convenient, high caloric dense foods together with a sedentary lifestyle, and genetic component also tend to increase the risk of obesity.4 Objectives ? Asses the health status of the adolescents in the selected districts of Tamil Nadu. ? Assess the nutrient intake of the obese adolescents. ? Impart nutrition education programme to the adolescents.
MATERALS AND METHODS
Selection of area: Based on convenience sampling technique, the investigator chose five districts [15 percent of total districts, as Tamil Nadu has 32 districts)] of Tamil Nadu (Coimbatore, Madurai, Salem, Tiruchirappalli, and Tirunelveli). The schools were selected with the official permission from the inspectors of matriculation schools. Hence based on purposive sampling technique, the investigator conducted the study in 25 matriculation higher secondary schools.
Selection of samples:
The samples were selected based on the following inclusion criteria –
- adolescents aged between 12 and 17 years.
- adolescents who are not included in any similar researches.
Only those adolescents who fulfilled the above mentioned criteria and those who consented to participate were included in the study. A stratified random sampling technique was adopted to select the samples to get an equal distribution of adolescents from each age group. The total sampling unit comprises of 6000 adolescents. One thousand and two hundred samples were selected from each district (600 boys and 600 girls). One hundred boys and one hundred girls were selected from each age group.
Conduct of the study
Demographic profile, food consumption pattern and lifestyle habits of adolescents:
School authorities were requested by the investigator to provide a list of children attending classes from standard seven to standard twelve. Anthropometric measurements (height, weight, waist and hip circumference) were taken and data regarding the samples were collected through the questionnaire. Questionnaire assessed the socioeconomic status, participation in sports, physical exercise, sleeping habit during day time, diet (vegetarian or non vegetarian), junk food consumption, meal pattern, frequency of visiting restaurants and other factors that influence physical health of representative samples of adolescents. Food frequency questionnaires are commonly used to assess habitual food intake. A self administered food frequency questionnaire was designed to assess the food consumption pattern of adolescents.
Anthropometric measurements:
The measurement of height is a standard component of most fitness assessments. The measurement was made and the result was recorded in the student health record and data log. The body weight was recorded using a standard balance scale. The weight was read on the scale and recorded immediately on the student’s health record and data log. BMI was classified using CDC percentiles (Centre for Disease Control, 2000). Adolescents with BMI more than or equal to 95th percentile with respect to age and gender were considered as obese, between 85th percentile and less than 95th percentile were considered as overweight and between 5th percentile and less than 85th percentile were considered as healthy weight and less than 5th percentile were considered as under nourished.
Dietary survey
Dietary survey constitutes the most important point of any complete study on nutrition status of individual or group. Dietary survey is the assessment of dietary or nutritional status at intermittent times to detect changes in the dietary or nutritional status of population. A dietary assessment is a comprehensive evaluation of a person's food intake. Measuring dietary intake in children enables the assessment of nutritional adequacy of individuals and groups and can provide information about nutrients, including energy, food, and eating habits.5 Weighed food record Food intakes might be assessed accurately by the Weighed Food Record.6 The weighed-food record is the most accurate record of individual food intake and in the precise weighing modality, is taken to represent the "gold" standard , though it does require the subject to be motivated and able to weigh and record accurately. It is therefore often used as the reference method for validating more expedient methods.7 Hence, to assess the dietary intake and adequacy of the diet consumed, weighed food record was adopted for three consecutive days. This method involves recording the weights of all foods prior to their consumption. Based on convenient sampling technique, 55 samples from each age group were selected for the dietary survey. The weighing was performed by the investigator by using a calibrated scale of the appropriate capacity (2 to 5 kg) and accuracy (± 1 to 5 g). The weight of all foods and beverages consumed by the samples and of any edible or non - edible leftovers were recorded by the investigator in a booklet. For meals consumed away from home, estimates of the weights were recorded by the subsamples and later checked by the investigator with the help of household measures. From this, the intake of energy, other macronutrients, and micronutrients for individuals was calculated using the Nutritive value of Indian foods (Indian Council of Medical Research, 2010) and compared with RDA (Recommended Dietary Allowances).8 Awareness on obesity and promoting healthy eating habits and positive lifestyle practices Sound nutrition can play a role in the prevention of several chronic diseases, including obesity, coronary heart disease, and certain types of cancer, stroke, and type 2 diabetes.9 Nutrition education programme involved educational components (classroom instruction by teachers, nutrition education integrated across curricula, peer training), environmental components (school menus, classroom snacks and special treats), and/or other components (physical activity, family education and community involvement). Statistical analysis and interpretation: Mean and standard deviation were calculated for the statistical analysis. Student's t test was used to compare the mean results of the analyzed variables and chi - square was used for the comparison of frequencies. ANOVA was employed to test the statistical significances of the differences between the BMI of boys and girls.
RESULTS
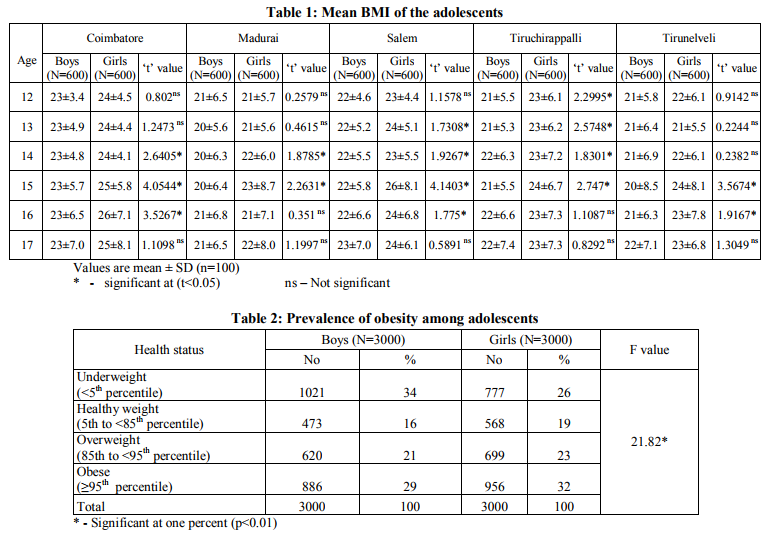
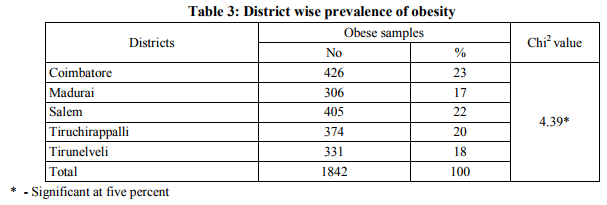
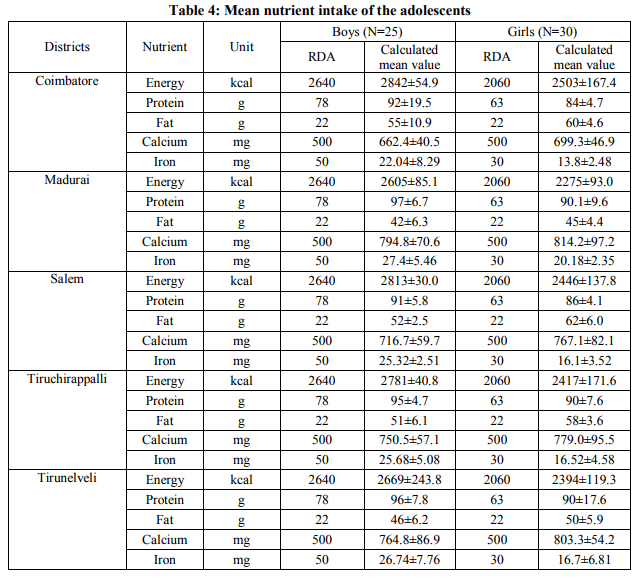
Mean BMI of the adolescents: BMI is a useful tool to identify possible weight problems; it screens children and teens for being obese, overweight, healthy weight and underweight. The BMI of the adolescents were assessed and the results are presented in Table 1. Girls had a higher BMI while compared with boys of the same age. Studies in Britain have indicated, females between the ages 12 and 16 have a higher BMI than males of the same age by 1.0 kg/m2 on average.10 Prevalence of obesity among adolescents: BMI is a reliable indicator of body mass fatness for most children and teens. BMI was classified using CDC percentiles (Centre for Disease Control, 2000). Table 2 shows the prevalence of obesity among the selected adolescents. Among 6000 adolescents, boys and girls with normal BMI were 16 percent and 19 percent respectively. The prevalence of overweight was 21 percent among boys and 23 percent among girls. The prevalence of obesity was 29 percent in boys and 32 percent in girls. The prevalence of underweight was 34 percent in boys and 26 percent in girls. Girls had a higher prevalence rate of overweight and obesity while compared with boys of the same age. ANOVA was employed to test the statistical significances of the differences between the BMI of boys and girls. Although there was no increase in the mean height of children and young adults between 1995 and 2002, weight and BMI increased year by year for all age and sex groups. As a result, there was a steady upward trend in the prevalence of overweight and obesity during this years.11 District wise prevalence of obesity: India is following a trend of other developing countries that are steadily becoming more obese. According to the National Family Health Survey (2007), Tamil Nadu ranks fourth among the States in obesity. Body Mass Index (BMI) calculation is used to assess the health status of the adolescents in five districts (Coimbatore, Madurai, Salem, Tiruchirappalli, and Tirunelveli) of Tamil Nadu and the results are presented in Table 3. Among 6000 adolescents, 23 percent were obese in Coimbatore whereas17 percent in Madurai, 22 percent in Salem, 20 percent in Tiruchirappalli, and 18 percent were obese in Tirunelveli Districts. The value of chi square was significant at five percent level. Mean nutrient intake of the adolescents: The nutrient intake of the adolescents selected for the survey were calculated and compared with the RDA. The nutrient intake of the adolescents belonged to the age group of 16 years were clearly depicted in the Table 4. The nutrient intake of the adolescents except for iron exceeded the Recommended Dietary Allowances. The mean calorie intake was higher among adolescents of Coimbatore District (Boys2842±54.9; Girls - 2503±167.4) when compared to other districts. Calcium intake was higher in Tirunelveli District (Boys - 764.8±86.9 mg/day; Girls - 803.3±54.2 mg/day) when compared to other districts. Nutritional needs during adolescence are increased because of the increased growth rate and changes in body composition associated with puberty.12
DISCUSSION
The study was carried out among 6000 adolescents of 12–17 years of age in five districts (Coimbatore, Madurai, Salem, Tiruchirappalli, and Tirunelveli) of Tamil Nadu. Among 6000 adolescents, 23 percent were obese in Coimbatore whereas17 percent in Madurai, 22 percent in Salem, 20 percent in Tiruchirappalli, and 18 percent in Tirunelveli Districts. The dietary survey (weighed food record method) was conducted among 55 obese adolescents from each age group in five districts of Tamil Nadu. The intake of energy, other macronutrients, and micronutrients for individuals was calculated using the Nutritive value of Indian foods (ICMR, 2010) and compared with RDA. The nutrient intake of the adolescents except for iron exceeded the Recommended Dietary Allowances. This may be due to frequent consumption of energy dense foods and fat-rich foods by the obese samples. The mean calorie intake was higher among adolescents of Coimbatore District (Boys2842±54.9; Girls - 2503±167.4) when compared to other districts. Calcium intake was higher in Tirunelveli District (Boys - 764.8±86.9 mg/day; Girls - 803.3±54.2 mg/day) when compared to other districts. This may be due to the excess consumption of milk and milk products and other calcium rich foods by the adolescents in Tirunelveli District. Similar results were observed for the adolescents of other age groups.
SUMMARY AND CONCLUSION
The study showed that adolescent obesity varies from each district with respect to family income, family history, dietary pattern, and lifestyle habits. The nutrient intake of the adolescents except for iron exceeded the Recommended Dietary Allowances. . It was also noted that the intake of girls is higher than boys. Nutrition education was imparted to the samples and parents in the Parents Teachers Association meeting. This session involved power point presentation on obesity, causes, risk factors, signs and symptoms, complications, dietary management, treatment and prevention. Pamphlets and Compact Discs containing information on obesity were distributed to the samples. The impact of nutrition education showed that the adolescents were more aware of the positive aspects of health and nutrition. It was concluded that individually targeted obesity prevention education programme will produce beneficial effects on dietary pattern of the obese adolescents.
ACKNOWLEDGEMENT
The authors thank the students, their parents and the staffs of the schools for their participation in the trial and their support. The author also thanks the Inspector of Matriculation Schools (IMS) of five districts (Coimbatore, Madurai, Salem, Tiruchirappalli, and Tirunelveli) for their help during the data collection phase. The authors acknowledge the immense help received from the scholars whose articles are cited and included in references of this manuscript. The authors are also grateful to authors / editors / publishers of all those articles, journals and books from where the literature for this article has been reviewed and discussed.
References:
1. Wright CM, Parker L, Lamont D, Craft AW. Implications of childhood obesity for adult health: findings from the thousand families cohort study. British Medical Journal 2001; 323: 1280–4.
2. Chopra M, Galbraith S, Darnton-Hill I. A global response to a global problem: the epidemic of over nutrition. Bull World Health Organ 2002; 80: 952-958.
3. Flodmark CE, Lissau I, Moreno LA, Pietrobelli A, Widhalm K. New insights into the field of children and adolescents’ obesity: the European perspective. Int J Obes Relat Metab Disord 2004; 28:1189-1196.
4. Friedman JM. Modern science versus the stigma of obesity. Nat Med 2004; 10: 563– 569.
5. Burrows TL, Martin RJ, Collins CE. A systematic review of the validity of dietary assessment methods in children when compared with the method of doubly labeled water. J Am Diet Assoc 2010; 110(10):1501- 10.
6. Li YP, He YN, Zhai FY, Yang XG, Hu XQ, Zhao WH, Ma GS. Comparison of assessment of food intakes by using 3 dietary survey methods [Article in Chinese].Zhonghua Yu Fang Yi Xue Za Zhi 2006; 40(4):273-80.
7. Anna Ferro-Luzzi. Weighed record Individual food intake survey methods. National Institute for Food and Nutrition Research, 2003; Rome, Italy.
8. Indian Council for Medical Research.Nutrient requirement and recommended dietary allowances for Indians, A Report of the Expert Group of the Indian Council of Medical Research 2010; AP, Hyderabad: 40, 41.
9. Botero D, Wolfsdorf JI. Diabetes mellitus in children and adolescents. Arch Med Res 2005; 36:281.
10. Health survey for England: The health of children and young People, http://www.archive2.officialdocuments.co.uk
11. Sproston.K and Primatesta.P. Health Survey for England 2002. Volume 1: The health of children and young people 2003. The Stationery Office, London.
12. Spear BA. Adolescent growth and development. J Am Diet Assoc 2002; 102:S23.
|
 IJCRR
IJCRR 


 This work is licensed under a Creative Commons Attribution-NonCommercial 4.0 International License


