IJCRR - 8(23), December, 2016
Pages: 39-46
Print Article
Download XML Download PDF
PRESCRIPTION AUDITING AND DRUG UTILIZATION PATTERN IN INDOOR PATIENTS OF PEDIATRICS DEPARTMENT
Author: Patel Neha, Shah Shreya, Asari Pratik, Amin Anand
Category: Healthcare
Abstract:Objectives: To analyze the rationality status of prescriptions and drug utilization pattern in indoor patients of pediatrics department.
Method: The present observational prospective study was undertaken in pediatrics indoor patient department for a period of six months during which data of 100 patients was collected. The prescriptions were analyzed for rationality score and rationality status (rational, semi-rational, irrational) using Phadke's criteria; a 30 point score system in which choice of drugs and their dose, unnecessary drugs, irrational drugs/combinations and use of hazardous drugs were taken into consideration. Data was also analyzed for drug utilization pattern using WHO- prescribing indicators.
Result: Data of total 100 patients was analyzed, of which 69 were male and 31 were female. Rationality scores of 100 prescriptions were in range of 30 to 19, with mean rationality score of 28.4%. Of 100 prescriptions, 91 were rational and 9 were semi-rational. Main reason for getting less score were improper dose and use of second choice drug or wrong selection of drug. Average number of drugs used was 6.01 per patientsitus judi slot online deposit pulsa tanpa potongan. 54.76% drugs were prescribed by generic situs slot, 33.33% by brand name and 11.90% by both. Drugs prescribed from WHO-EML for children were 48.81%. Antimicrobials were prescribed for 93 patients, of which most common were amoxicillin+ clavulanic acid, ceftriaxone and cefotaxime.
Conclusion: Though the results reflect rational prescribing in pediatrics department of our set up, there is still scope of improvement in areas of dosage calculation, proper documentation, prescribing drugs by generic name and from WHO-EML for children as far as possible
Keywords: Prescription audit, Drug utilization pattern, Rational drug utilization
Full Text:
INTRODUCTION
Drugs play an important role in disease prevention and in health care delivery. The availability and affordability of good quality drugs along with their rational use is required for effective health care.1 The prescription of a drug with proven efficacy at an optimal dose together with the correct information at an affordable price is very necessary to ensure the effective health care.2 The quality of life can be improved by increasing the standards of the medical treatment at all levels of the health care delivery system.3 A medical audit oversees the observance of these standards, which is defined as ‘the review and evaluation of the health care procedures and documentation for the purpose of comparing the quality of care which is provided, with the accepted standards situs slot’.4
Prescription auditing is a type of vigilance activity, which is beneficial in clinical practice in terms of reducing the burden of disease because of medication errors, i.e. because of irrational prescribing.5
In developing countries like India, a substantial proportion of medicines in the market are irrational fixed-dose-combinations and some of them are even hazardous. Analysis of a properly selected sample of prescriptions would reveal the extent of use of such irrational and hazardous drugs by doctors as well as irrational use of rational drugs. This will help in assessing the extent of wastage (health-wise and money-wise) due to irrational prescribing and in developing ways to overcome this wastage.6
Drug utilization research is defined by WHO as “the marketing, distribution, prescription, and use of drug in a society, with special emphasis on the resulting medical, social and economic consequences”.7
The principle aim of the drug utilization research is to facilitate rationale use of drugs in population. For the individual patient, rationale use of a drug implies the prescription of a well-documented drug in an optimal dose for a right indication, with the correct information and at an affordable price. Without knowledge on how drug are being prescribed and used, it is difficult to initiate discussion on rationale drug use and to suggest measure to change prescribing habits for the better.8
Infants and children constitute a large proportion of the population in developing countries. They are especially vulnerable to contract illnesses and to the harmful effect of drugs due to differences in pharmacodynamics and pharmacokinetics.9 They suffer from frequent but usually nonserious illnesses. Most of these are self limiting and often treated not only inappropriately but also resorting to polypharmacy.10 Epidemiological evaluation of medicine use in elderly is now a highly visible topic, but drug prescribing studies in pediatric patients have been limited. The need for the safe and effective drugs for use in sick neonates, infants, children and adolescents requires the establishment of thoughtful drug therapy strategies.11
Considering all these facts, the present study was designed to situs judi slot online deposit pulsa tanpa potongan check the rationality status and drug utilization pattern in indoor patients of pediatrics department.
MATERIAL AND METHODS
This observational prospective study was conducted in pediatrics in-patient department of a tertiary care teaching hospital attached to a Medical College, in western India for 6 months duration.
Pilot study was done to validate the designed proforma and feasibility of method, following which it was finalized for further work. Institutional ethics committee’s approval was obtained and verbal consent was taken from patients’ guardians before enrolling them into the study. All patients below the age of 18 years of either sex, admitted at pediatrics inpatient ward for any condition were included in the study. The patients referred to or from other specialties with conditions which can influence physician’s prescription or the patients admitted to/ transferred from NICU and PICU were excluded. Data of total 100 pediatrics in-patients were collected and were recorded in case record form. Relevant data of patients were taken from hospital records while they were admitted in the hospital. An attempt was made to include patients of different conditions or diseases admitted in pediatrics inpatient ward as far as possible.
After collecting data of all prescriptions, data were analyzed for rationality and drug utilization pattern by following criteria.
- Prescription analysis
All prescriptions were analyzed by using Phadke’s criteria.12, 13 While analyzing the prescriptions, to decide for the correctness of the drug, standard textbook of pediatrics (Essential Pediatrics; OP Ghai; 7th edition) and pharmacology (Principles of Pharmacology; HL Sharma and KK Sharma; 2nd edition) were referred. Prescriptions were discussed with two consultants suggested by the Head of pediatrics department for more clarification in case of some query regarding prescription. Prescription were analyzed for diagnosis mentioned or not, number of drugs prescribed per prescription, number of drugs prescribed by brand name or generic name, drug wise analysis of prescriptions, rationality score, rationality status of prescriptions and number of prescriptions showing use of unnecessary drugs, unnecessary injections, irrational drugs or combinations. For study of rationality status of prescriptions, a maximum of 30 points score system was assigned as follows:
? Main drug - 20 points
? Complementary drug – 10 points
Out of these total points, half of the points of each category of drugs were to be allotted for the correctness of the choice of drug according to condition and half for the correctness of the dose, route, frequency of drug administration and the duration of the treatment. If more than two drugs were needed to be given in a condition. The points allocated were subdivided accordingly. From total score obtained, points were deducted if prescription include Unnecessary drug (-5 points), Unnecessary injection (-5 points), Irrational drug / combination (-5 points) or Hazardous drug (-10 points). Based on the above mentioned criteria for analysis, net score was calculated and prescription were categorized as; 0 to 14 points –Irrational, 15 to 24 points – Semirational, 25 to 30 points – Rational .
B. Drug utilization pattern
By using the prescribing indicators according to the standard WHO guidelines, the data were analyzed to study number of drugs used by trade name and by generic names, average number of drugs per prescription, percentage of prescription with an antibiotic prescribed, number of fixed drug combinations used and number of drugs prescribed from essential medicine list [WHO- EML for children, April-2013].
RESULTS
Note: As our sample size N was 100, results are mentioned in numbers only where denominator is 100.
Out of 100 patients, 69 were male and 31 were female. Amongst males, most of the patients belonged to the age group of 1 to 4 years (46.38%) followed by 5 to 8 years (27.54%), while in females most of the patients belonged to 1 to 4 years (41.94%) followed by 9 to 12 years (22.58%) of age. Male: female ratio was 2.22:1.
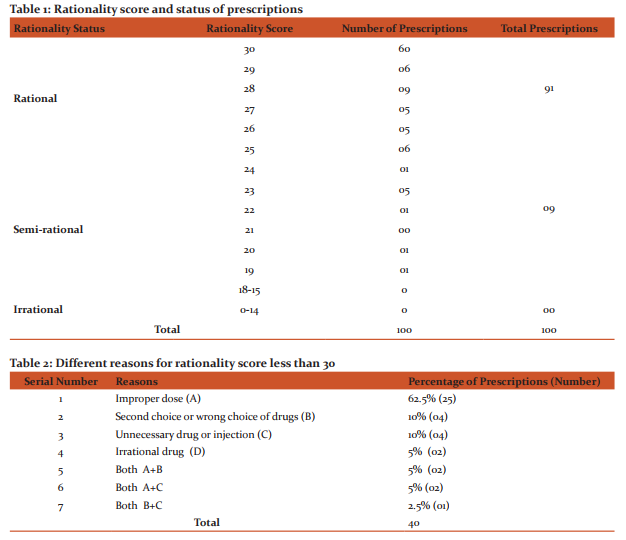
Of total 100 prescriptions, 91 and 9 prescriptions were rational and semi-rational respectively. There was no prescription with score less than 15, i.e. there was no irrational prescription (Table 1, Figure 1). When rationality score was calculated, 60 prescriptions had 30 score (maximum) followed by 31 and 9 prescriptions in range of 29-25 score and 15-24 score respectively. Minimum score of 19 was observed in one prescription (Table 1). Mean rationality score was 28.4. For total 40 prescriptions with rationality score less than 30, different reasons for less score were - improper dose in 25 (62.5%) prescriptions, second or wrong choice of drugs in 4 (10%) prescriptions, unnecessary drug or injection in 4 (10%) prescriptions. Irrational drug was prescribed in 2 (5%) prescriptions only. In 5 (12.5%) prescriptions, there was more than one reason for getting less scoring (Table 2).
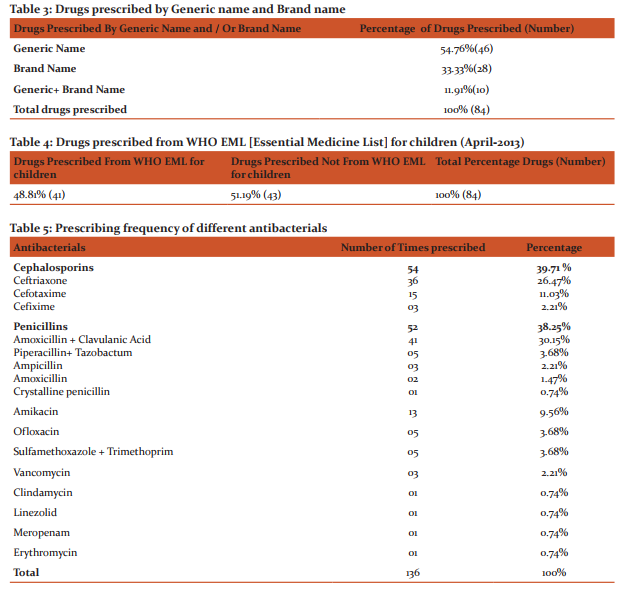
In 81 prescriptions, only provisional diagnosis was mentioned; while in 19 prescriptions, both provisional and final diagnosis were mentioned (Figure 2).
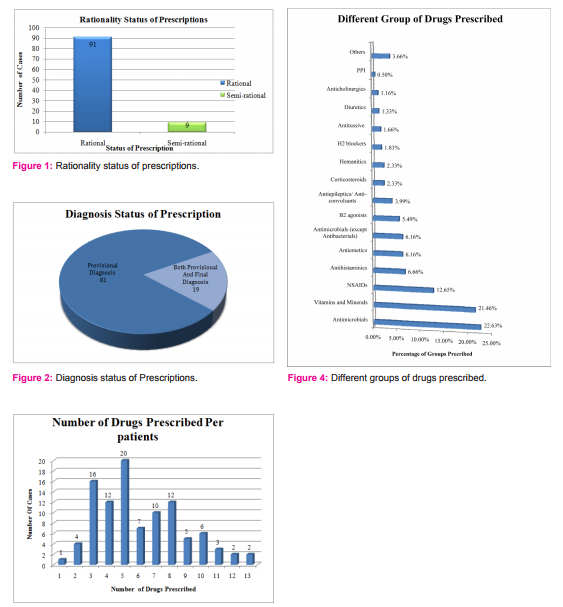
54.76% drugs were prescribed by generic name, 33.33% by brand name and 11.90% by both (Table 3). Drugs prescribed from WHO-EML for children (April-2013) were 48.81% (Table 4). In present study, number of drugs prescribed in any given patient ranged from 1 to 13. In about half of the patients ( i.e 48), 3-5 drugs were prescribed (Figure 3). Average number of drugs per patient was 6.01.
Out of 100 patients, antibacterial agent /agents was/were prescribed in 93, among which in majority of patients, one (42 patients ) or two (35 patients) antibacterials were prescribed. Maximum number of antibacterials prescribed was 5 in this study. The most frequently prescribed group of antibacterials were cephalosporins followed by penicillins while most common prescribing antibacterials were amoxicillin+ clavulanic acid, ceftriaxone and cefotaxime ( Table 5).
Drugs used for treatment of different conditions in pediatric cases were antibacterials (22.63%) vitamins and minerals (21.46%), NSAIDs (12.65%), antihistaminics (6.66%) and antiemetics (6.16%). Apart from these, β2 agonist, antiepileptics/anticonvulsants, corticosteroids, hematinics, H2 blockers, antitussive agents, diuretics, anticholinergics and proton pump inhibitors were also prescribed (Figure 4).
In present study, total 16 FDCs were prescribed out of which 6 FDCs were rational and 10 were irrational. Of 6 rational FDCs, 4 were present in WHO-EML for children, April-2013. 10 irrational FDCs included ibuprofen + paracetamol combination, hematinics and multivitamins.
DISCUSSION
Rational prescribing is an essential part of patient care. WHO has developed Essential Medicine List to promote rational prescribing. Irrational prescribing is common worldwide with different prevalence rate at different set up. This type of study helps in assessing the extent to which rational prescribing is practiced by clinician in government as well as private set up. Pharmacological management is the most common and important form of treatment in the care of pediatric patients and irrational prescribing may lead to drug-drug interactions, development of resistance, adverse effects of drugs etc.
When we looked at the rationality of the prescriptions, we found 91 prescriptions as rational and 9 semirational. Rima Shah et al. (2011) in their study found 39.5%, 32.3%, and 28.3% rational, semirational and irrational prescriptions respectively while Shah AM et al. (2010) in their study found 53%, 30% and 17% prescriptions to be rational, semirational and irrational respectively.13, 14 Sneha Patel and Bharat Gajjar (2012) in their study found more rational prescriptions from public sector (82) compared to private sector (42). 6 Out of 100 prescriptions, 60 prescriptions had 30 score (maximum) followed by 31 and 9 prescriptions in range of 29-25 score and 15-24 score respectively. Minimum score of 19 was observed in one prescription. Mean rationality score was 28.4. In another study done by Shah AM et al. (2010), in which prescriptions of 100 OPD patients of tertiary care teaching hospital were analyzed, the mean rationality score found was 20.56. 14 In a similar study for geriatric patients (age≥ 65 years) carried out by Rima Shah et al. (2011) at tertiary care teaching hospital, the mean rationality score was 18.47.13 Sneha Patel and Bharat Gajjar (2012) had done a study of prescription audit collecting prescriptions from general practitioners from public and private sectors, using same Phadke’s criteria. In their results, they found that the mean rationality score was 25.83 for public sector and 20.45 for private sector.6 Gajjar BM (1999) in his work reported average rationality score of 19.23 and 20.83 for prescription obtained from physician of teaching institute and private sector respectively. 12
Differences found in rationality score and rationality status of prescriptions in different studies could be because of following reasons, operating one or more at a time.
- Some studies were done in tertiary care teaching hospital while some studies were done both in public and private hospitals. In one study, prescriptions from private sector and primary health care centre were compared.
- In these different studies, patients included were either from inpatient department or outpatient department, or inpatient as well as outpatient departments.
- Prescribing doctors were either MBBS or MD/MS in different studies.
- For some conditions, standard treatment guidelines are available making prescription analysis easy. For majority of conditions, standard treatment guidelines are not available and researchers have to refer some standard reference for deciding rationality of treatment. Referring different sources may lead to variations in rationality score.
In present study, total 40 prescriptions obtained score less than 30 for which major reasons were improper dose in 25(62.5%) prescriptions, second or wrong choice of drugs in 4 (10%) prescriptions, unnecessary drug or injection in 4 (10%) prescriptions. In a study done by Phadke et al. (1995), there were 47.4%, 23.8%, 10.5% and 19% prescriptions containing unnecessary drugs, unnecessary injections, hazardous drugs and irrational drug respectively.6
In present study, in 81 prescriptions only provisional diagnosis was mentioned; while in 19 prescriptions, both provisional and final diagnosis were mentioned. Sneha Patel and Bharat Gajjar (2012), found 81% (public sector) and 84% (private sector) prescriptions in which diagnosis was mentioned while Gajjar BM (1999) found 60% (teaching institute) and 89% (private sector) prescriptions with diagnosis mentioned.6, 12
Aggressive promotional strategies by pharmaceutical companies may lead to prescribing by brand name may lead to increased cost of therapy. Prescribing drugs by their generic name, prescribing from essential medicine list and rational prescribing are recommended measures which reduce the cost of drugs in patients and to health care system in government setups. In present study, total 84 different drugs were prescribed. 54.76% drugs were prescribed by generic name while 33.33% drugs were prescribed by brand name. There were 11.91% drugs which were prescribed by generic names in some patients and by brand names in others. When we compared results of present study with that of other studies, it was found that drugs prescribed by generic name were as high as 62.3% [Vishwanath et al. (2014)] and 67.25% [Manoj Kumar Saurabh et al. (2010)] as compared to present study while Rajesh et al. (2014) in their study, found only 15% of drugs prescribed by generic name which is low as compared to present study.15, 16, 17 In a study by Akhtar et al. (2012), percentage of drugs prescribed by generic name was only 2.63%.18 All these results suggest that there is a need to promote drug prescribing by generic name.
Out of total 84 different drugs prescribed in 100 patients in present study, 48.81% drugs were prescribed from the WHO List of Essential Medicines for children, April-2013. When results of present study were compared with other studies, percentage of drugs prescribed from WHO Essential Medicine list in other studies were 90.23% [Akhtar et al. (2012)], 86.42% [Vishwanath et al. (2014)] and 35.19% [Girija Sachdeo et al. (2013)]. 18, 15, 19
Prescribing minimum required number of drugs per patient carries less chances of drug - drug interactions and adverse effects of drugs, decreased cost of therapy and increased patient‘s compliance. In present study, number of drugs prescribed in any patient ranged from 1 to 13 with an average of 6.01% drugs per patient. In other studies, average number of drugs per encounter were 5.69 (inpatients) [Vishwanath et al. (2014)], 5.61 (outpatients + inpatients) [Akhtar et al. (2012)], 2.7 (outpatients + inpatients) [Rajesh et al. (2014)], 2.35 (outpatients) [Girija Sachdeo et al. (2013)].15, 18, 17, 19 Manoj Kumar Saurabh et al. (2010), in their study found that average number of drugs prescribed was 2.79 for government doctors and 3.12 for private practitioners.16 In the similar study, done by Rewa Shinde et al. (2013), average number of drugs per prescription was 2.11 and 2.22 for tertiary care teaching hospital and private hospitals respectively. 20
Improper use of antibacterials - overuse or not using when required - is one of the important reasons of irrational prescribing and development of antimicrobial resistance. In 93 patients in whom antibacterial was/were prescribed, in majority of them, one (42 patients) or two (35 patients) antibacterials were prescribed. Maximum number of antibacterials prescribed was 5 in single patient. Akhtar et al. (2014) in their study found use of anti-infectives in 81.12% patients while Rajesh et al. (2014) found use of antibiotics in 32% patients.18, 17 In a study done by N. Venkateswaramurthy et al. (2013), it was found that antibiotics were prescribed in 218 out of 286 prescriptions. Of this, 124 (43.4%) had a single antibiotic, while 70 (24.5%), 21 (7.3%) and 3(1%) had 2, 3 and 4 antibiotics per prescription respectively. 21
In this study, total 136 antibacterial agents were prescribed. The most frequently prescribed antibacterials were Cephalosporins followed by penicillins. Among cephalosporins, only third generation cephalosporins were prescribed which included ceftriaxone (26.47%) in majority of instances; while among penicillins, most frequently prescribed was amoxicillin+clavulanic acid (30.15%). Other antibacterials prescribed were amikacin, ofloxacin, sulfamethoxazole + trimethoprim, vancomycin, clindamycin, linezolid, meropenam and erythromycin. In the study by Vishwanath M. et al. (2014), among antimicrobials, penicillins (28.75%) were most commonly prescribed, followed by aminoglycosides (23.33%) and cephalosporins (17.5%).15 N. Venkateswaramurthy et al. (2013) in their study found that among antimicrobials, most commonly prescribed were beta-lactams followed by quinolones and aminoglycosides, while Rajesh et al. (2014) found that cefixime was most commonly prescribed antibiotic followed by ceftriaxone and amoxicillin.21, 17
Total drugs prescribed in the present study were 601. Drugs used for treatment of different conditions in pediatric patients were antibacterials (22.63%) vitamins and minerals (21.46%), NSAIDs (12.65%), antihistaminics (6.66%) and antiemetics (6.16%). Apart from these, β2 agonist, antiepileptics/anticonvulsants, corticosteroids, hematinics, H2 blockers, antitussive agents, diuretics, anticholinergics and proton pump inhibitors were also prescribed. Akhtar et al. (2011) in their study found that most commonly prescribed pharmacological group was antipyretics (100%) followed by cold and cough preparations (88.81%) and anti-infectives (81.12%).18 In the study by Vishwanath et al. (2014), it was found that most commonly prescribed pharmacological group was antimicrobial (28.10%) followed by drugs acting on respiratory system (12.18%) and NSAIDs (7.50%).15 In the study by Rewa Shinde et al. (2013), most commonly prescribed drug groups were antimicrobials (37.81% and 37.99%) followed by vitamins/minerals (22.74% and 18.47%) and analgesics (13.46% and 11.87%) in tertiary care teaching hospital and private hospitals respectively, while in similar Study by Manoj Kumar Saurabh et al. (2010) most commonly prescribed pharmacological groups were antimicrobials (25.44% and 25.96%) followed by NSAIDs (19.80% and 21.66%) in prescriptions of government doctors and private practitioners respectively.20, 16 N. Venkateswaramurthy et al. (2013) found that most commonly prescribed group was anti-infectives (24.8%) followed by anti inflammatory (20.6%) and drugs of gastro intestinal system (14.7%).21
In present study, total 16 FDCs were prescribed out of which 6 FDCs were rational and 10 were irrational. Of 6 rational FDCs, 4 were present in WHO-EML for children, April-2013. 10 irrational FDCs included Ibuprofen + Paracetamol combination, hematinics and multivitamins. In the study by Girija Sachdeo et al. (2013), 43 (39.81%) FDCs were prescribed in which 12 (27.91%) were rational and 9 (20.93%) were from WHO-EML for children [March-2011]. 19 In the study by Rewa shinde et al. (2013), total 139 and 97 FDCs were prescribed in public and private sector respectively, out of which 55 and 35 were rational and 45 and 23 were present in WHO-EML for children [March-2011] for public and private sector respectively. 20
CONCLUSION
This type of study helps to evaluate, monitor and if necessary, suggest changes or modifications in prescribing practices of clinicians which will ultimately make patient care more rational and cost- effective.
Though the results reflect rational prescribing in pediatrics department of our hospital set up, there is still scope of improvement in areas of dosage calculation, proper documentation, prescribing drugs by generic name and from WHO-EML for children as far as possible.
Development and implementation of Standard Treatment Guidelines based on essential drug concept and promoting rational drug therapy will lead to more and more rational prescribing. Periodic prescriptions analysis and effective feedback to clinician should be done based on results to ensure rational prescribing and effective health care management.
LIMITATIONS OF THE STUDY
Limitations of this study were small sample size, non randomized selection of patients, small duration of study and limitations related to Phadke’s criteria.
ACKNOWLEDGMENT
Authors acknowledge the immense help received from the scholars whose articles are cited and included in references of this manuscript. The authors are also grateful to authors/ editors/ publishers of all those articles, journals and books from where the literature for this article has been reviewed and discussed. Authors would like to acknowledge all the faculty of pediatrics department for their valuable guidance, help and support in the present study.
FUNDING AND SUPPORT: None.
CONFLICT OF INTEREST: None.
References:
- Lalan BK, Hiray RS, Ghongane BB. Drug prescription pattern of outpatients in a tertiary care teaching hospital in Maharashtra. Int J Pharm Bio Sci. 2012 july; 3(3): 225-229.
- Introduction to drug utilization research Geneva: WHO; 2003.6-9. Available at http://apps.who.int/medicinedocs/pdf/s4876e/s4876e.pdf.
- Curtis P, Coll J.R. Medical audit in general practice. Gen. Pract. 1974; 24:607-11.
- Patterson H.R., Coll J.R. The problems of audit and research. Gen. Pract. 1986;36:196- 200.
- Afroz Abidi*, Surabhi Gupta, Saurabh Kansal. Prescription auditing and drug utilization pattern in tertiary care teaching hospital in western UP. Int J Basic Clin Pharmacol. 2012 Dec;1(3):184-190 .
- Patel S, Gajjar B. Evaluation and Comparison Of Prescribing Pattern Of General Practitioners from Public and Private Sectors. Natl J Physiol Pharm Pharmacol. 2012; 2(1): 33-38.
- WHO Expert committee report. The use of essential drug. WHO TRS 615,1977. Available at http://apps.who.int/iris/bitstream/10665/41272/1/WHO_TRS_615.pdf
- Available at http://www.apps.who.int/medicinedocs/en/d/Js4876el. Accessed 03 October 2016.
- PR Shankar, DK Upadhyay, P Subish, AK Dubey, P Mishra. Singapore Med J, 2006; 47(4): 261 - 265.
- YM Nazima, D Sagun, G Barn. Bangladesh J Pharmacol. 2009; 4: 39-42
- Kliegman, Behrman, Jenson, Stanton. Nelson Text book of Pediatrics. 18th Edition. Philadelphia : Elsevier Health Sciences;2007; 331-332.
- Gajjar BM, Evaluation and comparison of prescribing pattern of physician from the institute and private sector for rational drug therapy (dissertation), Vallabh Vidhyanagar, S.P. Univ, 1999.
- Shah RB, Gajjar BM, Desai SV. Evaluation of the appropriateness of prescribing in geriatric patients using Beers criteria and Phadke’s criteria and comparison thereof. J Pharmacol Pharmacother 2011; 2: 248-252.
- Shah AM, Dhanani JV, Shah RB. Evaluation of prescription pattern in terms of essentiality and rationality and assessment of Hospital pharmacy services utilization in tertiary care teaching hospital. Indian J. Pharm. Pract. 2010; 3(2): 11-15.
- Vishwanath M., Reddy NS., Devadas S. Assessment of drug utilization in hospitalized children at a tertiary care teaching hospital. J. Chem.Pharm. Res. 2014; 6(2): 592-598.
- Saurabh MK, Yadav AK, Gupta P. Comparative study of prescribing behaviors of government doctors of teaching hospital and private practitioners in Jhalawar City (Rajashtan). J.Pharm. Sct. and Res., 2010; 2(4): 208-215.
- Suman RK, Mohanty NC, Mohanty IR. The study of drug usage patterns in pediatric patients at MGM Hospital, Navi Mumbai. World Journal of Pharmaceutical Research. 2014; 3(4): 734-743.
- Akhtar MS, Vohara D, Pillai KK. Drug prescribing practices in pediatric department of a North Indian University Teaching Hospital. Asian J Pharm. Clin. Res. 2012; 5(1): 146-149.
- Sachdeo G, Keche Y, Yegnanarayan R. Prescription analysis of drugs prescribed for children in some town of Mahrashtra. Asian Journal of Biomedical And Pharmaceutical Science. 2013; 3(21): 17-19.
- Shinde R, Keche Y, Yegnanarayan R. Prescription analysis of drugs prescribed for children in pune, Mahrashtra, India. International Journal of Biological And Pharmaceutical Research. 2013; 4(7): 528-532.
- Venkatswaramurthy N, Murali R, Kumar RS. The Study of Drug Utilization Pattern In Pediatric patients. International Journal of Pharmacy And Pharmaceutical Sciences. 2013; 5(3): 140-144.
- Karandikar Y S, Dhande PP. Measuring Inappropriate Prescriptions in Geriatric population:Overview of various screening tools. International Journal of Medical Research and Health Science. 2013; 2(3): 636-642.
|
 IJCRR
IJCRR 


 This work is licensed under a Creative Commons Attribution-NonCommercial 4.0 International License


