IJCRR - 5(5), March, 2013
Pages: 117-124
Date of Publication: 22-Mar-2013
Print Article
Download XML Download PDF
EFFECT OF CINNAMON BARK ON BLOOD GLUCOSE, SERUM INSULIN AND INSULIN SENSITIVITY IN ALLOXAN INDUCED DIABETIC RABBITS
Author: Khalse M. S., Daswani B.R., Ghongane B.B.
Category: Healthcare
Abstract:Aims: Cinnamon seems to be highly bioactive compound, appearing to mimic the effect of insulin through increased glucose uptake in peripheral tissues. The present study was planned to explore the potential antidiabetic, serum insulin and insulin sensitivity properties of cinnamon bark and compare its effects with antidiabetic agents in diabetic rabbit model. Methods and Material: Diabetes was induced in rabbits using alloxan (90mg/kg IV). Four groups (n=6 each) received suspensions of cinnamon (150mg / kg OD orally), glyburide (0.35 mg /kg orally), metformin (35mg/kg BD orally) or vehicle (6 ml of 5% gum tragacanth). Blood samples were collected weekly thereafter for five weeks to measure fasting blood glucose level, s. insulin level, HOMA-IR index. Results: Administration of cinnamon powder reduced blood glucose level and elevated serum insulin in diabetic rabbits over a period of 5 weeks. Results for HOMA \?IR are inconsistent in this study. Conclusions: Our results suggest that cinnamon extract significantly improved hyperglycemia and potentiate insulin level in diabetic rabbit model but its role on insulin sensitizing property still remains unclear.
Keywords: Cinnamon, diabetes, hyperglycemia, insulin, alloxan
Full Text:
INTRODUCTION
Diabetes mellitus can be described as a group of metabolic disease characterized by chronic hyperglycemia resulting from defects in insulin secretion, insulin action or both.1 Currently insulin and oral antidiabetic agents are the mainstay of treatment but associated with major limitations like hypoglycemic episodes, primary/ secondary failure and inability to prevent premature atherosclerosis due to hyperinsulinemia in case of insulin resistance. Aqueous extracts from cinnamon have been shown to increase in vitro glucose uptake and glycogen synthesis as well as to increase phosphorylation of the insulin receptor. 2 In addition, these cinnamon extracts are likely to aid in triggering the insulin cascade system. 3 These data suggest that CE prevents the development of insulin resistance, at least in part by enhancing insulin signaling and possibly via the NO pathway in skeletal muscle. An aqueous extract of cinnamon has also been shown to improve insulin sensitivity in humans.4 The present study was planned to explore the potential antidiabetic, serum insulin and insulin sensitivity properties of cinnamon bark and compare its effects with antidiabetic agents like glyburide and metformin.
MATERIALS AND METHODS
Animal care and maintenance: Thirty adult healthy male albino rabbits (1.2- 2 kg) were obtained from the central animal house facility of B J Medical College and Sassoon General Hospital, Pune, Maharashtra and kept under observation for one week before experimentation. All the rabbits were kept in cages and maintained in a well ventilated animal house with 12 h light and dark cycle. The animals were fed with water and standard institutional feed ad libitum, supplied by this institution. All the experiments were performed after obtaining prior approval from IAEC. (BJMC/EC/Pharmac/DA-0907087- 44 dated 20-09-2007). Research was conducted in accordance with the internationally accepted principles for laboratory animal use and care as found in the European Community guidelines (EEC Directive of 1986; 86/609/EEC). Materials Cinnamon (Cinnamomum zeylanicum) powder was obtained from Ghadiwal Vaidya Pharmaceutical, Pune. The taxonomical identification of the plant was done by Indian drug research association & Laboratory, Pune (Report no. 315 dated 21-3-2009). Alloxan monohydrate was purchased from Sigma-Aldrich, St. Louis, USA. Blood glucose was estimated by glucometer (GOD-POD method) One touch Glucometer (Johnson and Johnson, USA). Tablet formulation of glyburide and metformin and other chemicals like gum tragacanth were obtained from local drug store of B. J. Medical college, Pune. Insulin concentration was determined by radioimmunoassay with a commercial kit (DiaSorin, Saluggia, Italy). The assay had a sensitivity of 0.3µIU/ml. Intra-assay and inter-assay coefficients of variation for the method were less than 4% and less than 8.5%, respectively. Dosage Cinnamon powder suspension: 250mg/ml Glyburide (Glibenclamide) powder suspension: 0.12mg/ml Metformin powder suspension: 12 mg/ml A Pilot study was carried out to find out dose of alloxan monohydrate that would induce adequate hyperglycemia without producing death of any rabbit. Twenty four adult male albino rabbits weighing around 1.5-2 kg of were selected. After fasting for 24-48 hrs., solution of alloxan monohydrate (5%) (90 mg /ml) was administered by intravenous route in marginal vein of ear. Blood samples were collected at interval of 15 min, 240min, 3 day and 10 day. Animals having blood glucose level of 170 mg% were selected as diabetic animals. Animals were divided into four groups [n=6]. Group 1: Received 150mg/kg/day Cinnamon OD orally in 6 ml of 5% gum tragacanth Group 2: Received 0.35 mg/kg/day Glyburide OD orally in 6 ml of 5% gum tragacanth Group 3: Received 35 mg/kg/day Metformin BD orally in 6 ml of 5% gum tragacanth Group 4: Received suspending agent OD orally 6 ml of 5% gum tragacanth (vehicle) The dose of cinnamon was extrapolated from the dose used in most clinical studies (3gm/day). 5,6,7,8 Glyburide and metformin doses were extrapolated from standard adult human dosage. All groups received drugs for 5 weeks. All parameters in present study were measured at baseline level [after confirming the induction of diabetic state] and weekly for 5 weeks thereafter. Estimation of parameters Fasting Blood glucose, Serum insulin detectionRadioimmunoassay, HOMA-IR at weekly interval for 5 weeks. HOMA –IR score The Homeostasis Model Assessment (HOMA) is designed to predict the homeostatic concentrations of fasting insulin and glucose, which arise from varying degrees of beta-cell deficiency and insulin resistance. The model is nonlinear, but can be simply approximated. This type of HOMA score is currently being evaluated in clinical practice for determining fasting glucose and insulin levels. HOMA-IR = insulin resistance = (fasting insulin in µIU/ml) × (fasting plasma glucose in mg/dl)/22.5 x18. We calculated HOMA-IR scores before and following alloxan administration for five weeks.9
STATISTICS
Each parameter was compared among different variables using ‘Unpaired-t’ test. The value for each parameter at every instance was compared with the value of the respective parameter at the time of induction of diabetic state within the group using ‘Paired-t test’. ‘Unpaired-t test’ was applied to analyse the change in different variables from diabetic state among the various.
RESULTS
Baseline blood glucose levels (BGL) were similar in all groups Cinnamon group, Glyburide group, Metformin group, Control group before administration of alloxan. Alloxan administration induced hyperglycemia in all rabbits which was statistical significant [p<0.05]. Extent of hyperglycemia was similar in all four groups when unpaired test was applied to the change in the values of BGL from baseline state. In the control group, hyperglycemia produced due to alloxan administration remained consistent throughout the study period. Weekly values of BGL did not differ significantly from values of diabetic state. Administration of glyburide reduced BGL significantly in diabetic rabbits as early as 1 week after which BGL remained low throughout the study period. BGL at weekly interval in Glyburide group was significantly lower than BGL values of control group. Change of BGL values from diabetic state indicating antihyperglycemic effect in Glyburide group was significantly greater when compared to change in BGL values of control group [p<0.05]. Administration of metformin tended to reduce BGL in diabetic rabbits. During 1st four weeks, there was a definite trend of decreasing BGL but statistical significance was obtained only at the end of fifth week [p<0.05] (Table 1). BGL in Metformin group was lower than BGL in control group but again statistical significance was achieved at the end of fifth week. Administration of cinnamon powder reduced BGL over a period of 5 weeks. There was a continuous trend of decreasing BGL however, statistical significance was obtained only in 1st and 2nd weeks when compared to diabetic state [p<0.05]. BGL in cinnamon group more or less similar to BGL values in metformin except at the end of five weeks later where metformin showed lower BGL values (Table 1).
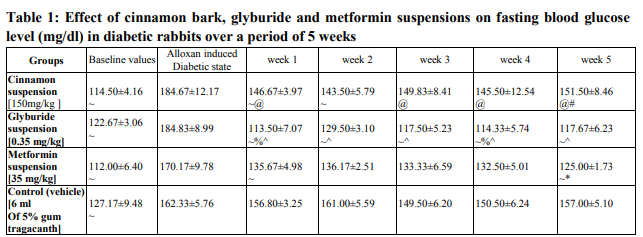
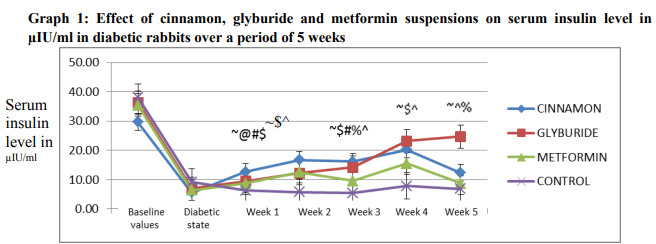
group;* P<0.05 as compared to control (vehicle)-treated group; ~ P<0.05 weekly values is considered statistical significant as compared to diabetic state. Baseline serum insulin levels were similar in all groups before administration of alloxan. Alloxan administration caused decrease in insulin levels which was statistical significant [p<0.05]. Insulin levels were decreased to similar extent in control group and maintained throughout the study period. Glyburide has also increased serum insulin level and there was a continuous trend of increasing insulin levels which was statistical significant [p<0.05] in 2nd ,4th and 5th week as compared to control group and in 3rd and 5th week as compared to Metformin group [p<0.05] (Graph 1). Metformin group has not shown any significant change in insulin levels. After treatment with cinnamon powder, insulin levels were increased as compared to initial diabetic state which was statistical significant throughout the study period. Similarly statistical significance was seen with Glyburide and Metformin groups in 1st week and 2nd week. Significance was clearly observed with control group throughout the study period (Table 2). Increased insulin levels in cinnamon group was also statistical significant with control group during 5 weeks. While this change was significant in 1st, 2nd and 5th week when these values were compared to Glyburide group and in 1st and 3rd week when compared with Metformin group. [p<0.05] (Graph 1)
Data is expressed as mean ± S.E.M (n=6); @P<0.05 as compared to glyburide-treated group; # P<0.05 as compared to metformin-treated group;$ P<0.05 as compared to control (vehicle)-treated group;% P<0.05 as compared to metformin-treated group;^ P<0.05 as compared to control (vehicle)-treated group;* P<0.05 as compared to control (vehicle)-treated group; ~ P<0.05 weekly values is considered statistical significant as compared to diabetic state. At baseline HOMA-IR was same in all groups. Administration of alloxan did not alter HOMA-IR in any group. When compared to diabetic state HOMA-IR values remained same in all groups however, the HOMA-IR in Cinnamon and Glyburide group was slightly higher than the control and Metformin group (Graph 2) (Table 2).
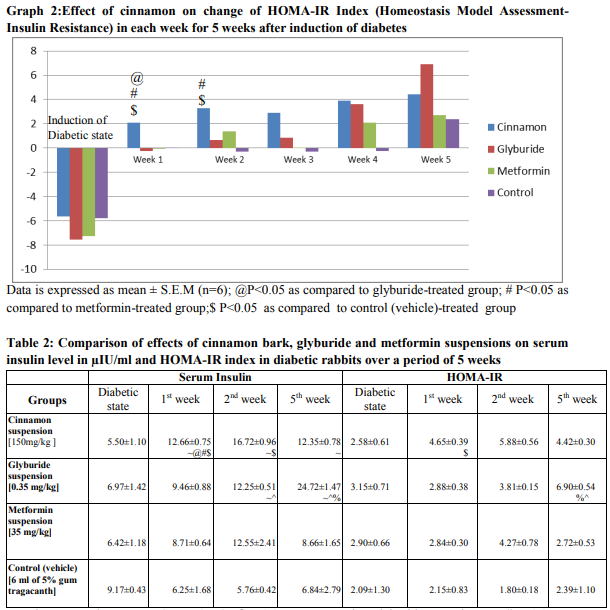
Data is expressed as mean ± S.E.M (n=6); @P<0.05 as compared to glyburide-treated group; # P<0.05 as compared to metformin-treated group;$ P<0.05 as compared to control (vehicle)-treated group;% P<0.05 as compared to metformin-treated group;^ P<0.05 as compared to control (vehicle)-treated group; ~ P<0.05 weekly values is considered statistical significant as compared to diabetic state.
DISCUSSION
In the control group, hyperglycemia produced due to alloxan administration remained consistent throughout the study period of 5 weeks. β-cell destruction induced by oxidative stress of alloxan was sufficient to decrease the levels of Insulin to similar extent in control group and maintained throughout the study period. HOMA –IR was not altered after administration of alloxan in rabbits and showed irregularities suggesting that it is not appropriate model for studying insulin resistance. Present glycemic data demonstrated that glyburide has a significant anti- hyperglycemic effect which appeared as early as one week following diabetic induction. It also suggests that anti hyperglycemic effect in Glyburide group is more potent than that of seen in Metformin and Cinnamon groups. The insulin secretagogue effect of glyburide is evident from the observation that it improved serum insulin level and there was a continuous time-related trend for increasing insulin levels. HOMA-IR was not altered but values were higher than Metformin and Control groups. During 1st four weeks, there was a definite trend of decreasing BGL but statistical significance was obtained only at the end of fifth week suggesting delayed onset of anti-hyperglycemic effect. This effect was not associated with rise in insulin level indicating its dominant peripheral action on liver and skeletal muscle in reducing blood sugar level. HOMA-IR was not altered in this group. There was a continuous trend of decreasing BGL in Cinnamon group. However, statistical significance was obtained only in 1st and 2nd week when compared with diabetic state. It is clear from the study that cinnamon bark has antihyperglycemic effect which is less than glyburide but comparable with metformin in alloxan induced diabetic rabbits. Anti-hyperglycemic effect was significant in the initial weeks of the study suggesting its transient action. Decreased response of the cinnamon may be due to development of tolerance to anti-hyperglycemic effect after certain period of time; in this case it is after four weeks. It is also likely to be related to the small sample size of our study. Recent finding in one clinical study conducted by 10 indicates that consuming three gram per day of cinnamon for eight weeks leads to significant reduction in some biochemical variables compared with baseline (i.e., fasting blood glucose (FBG) decreased by 9.2%. However, fasting blood glucose levels were decreased by 17% in present study. These reductions were significant as compared with placebo group. Similar results were obtained in one study conducted by 11. A significant reduction in fasting plasma glucose (FPG) was observed at week 12 compared to baseline in the cinnamon group. In present study, fasting blood glucose level was reduced rapidly in the initial two weeks of the study after diabetes induction and lasted for short duration in cinnamon group. 6 reported their study as the first U.S. study examining the effects of cinnamon on glucose levels in subjects with type 2 diabetes and showed that cinnamon powder (Cinnamonum cassia), taken over a 40-day period, has no significant change in any glycemic parameter. As per report cinnamon taken at dose of one gram daily for 3 months produced no significant change in insulin levels too. According to Khan et al7 , addition of 1, 3, or 6 g of cinnamon to diet led to a significant decrease in mean fasting serum glucose (18–29%) level. Results for fasting blood glucose level were coherent with present study. Rosado et al12 reported that fasting glucose levels were decreased by 8% in treatment group after 40 days of supplementation. After treatment with crude form of cinnamon, insulin levels were increased as compared to initial diabetic state which was statistical significant throughout the study period indicating its action like insulin secretagogue agent. These insulin values were also significantly higher than the Glyburide and Metformin groups at least during initial two weeks of the study. In contrast to this, Cheng DM et al (2012) 13demonstrated that cinnamon extract has insulin-like effect causing inhibition of hepatic glucose production and decreased the gene expression of enzymes involved in hepatic gluconeogenesis. However, as insulin level was not measured, this study cannot rule out the possibility that effect seen with Cinnamon group was due to active agent that has dual action like insulin secretion enhancer and insulino-mimetic action. HOMA-IR was not altered in Cinnamon group. HOMA-IR values were higher than Metformin and control groups. Thus, we can conclude that antihyperglycemic effect of cinnamon is not relevant to improving the insulin sensitivity. In one of the studies conducted by Boqué N et al 14 reported decrease in HOMA-IR index by cinnamon extract as against in present study. Reasons for difference in result may be due to alloxan utilisation for diabetes induction and species variation. Two trials reported data on insulin sensitivity for eighty two participants. First trial conducted by Altschuler (2007)5 reported the ratio of carbohydrates to insulin (CHO/unit insulin) to demonstrate insulin sensitivity. Their findings indicate that there was no statistically significant difference in insulin sensitivity between cinnamon and placebo groups. Vanschoonbeek (2006) 15 measured insulin sensitivity as HOMAIR index and suggested that there was no significant difference in insulin sensitivity among treatment groups. Data were not suitable for subgroup or sensitivity analysis. Another human study demonstrated that oral administration of cinnamon extract for duration of eight weeks improved insulin sensitivity in nondiabetic women with polycystic ovarian syndrome.16 The mean values of HOMA-IR in Cinnamon group decreased significantly from a pre-treatment value of 2.57 to 1.43, which was not statistically different from that of the normoovulatory controls presumably without insulin resistance. Whereas, present study reported no reduction in index in any of the study group throughout study period. Difference in study population might be a probable reason for variation in results.
SUMMARY AND CONCLUSION
In conclusion, cinnamon reduced serum glucose and elevated serum insulin in diabetic rabbits. Results for HOMA –IR are inconsistent in this study. These findings, however, need to be confirmed in the diabetic human population in order to draw valid conclusions. Present study has following shortcomings like animal study resulting in species variation, alloxan diabetic model, less duration of the study and small sample size. Further studies would be required as many features of cinnamon are still to elucidate in detail through well-defined and adequately powered randomized controlled clinical trials before recommendations are made for the use of cinnamon as an effective treatment for humans.
ACKNOWLEDGEMENT
The author wishes to acknowledge the constant encouragement and support provided by faculty members of Pharmacology and Biochemistry department of B J Medical College, Pune and KEM Hospital Research Centre, Pune during the preparation of this manuscript.
DISCLOSURES
The authors report no conflicts of interest related to the subjects or products discussed in this article.
References:
1. American Diabetes Association. Diabetes Care, Volume 35, supplement 1, January 2012
2. Khan A, Bryden NA, Polansky MM, Anderson RA: Insulin potentiating factor and chromium content of selected foods and spices. Bio Trace Element Res 1990; 24:183– 188.
3. Imparl-Radosevich J, Deas S, Polansky MM, et al. Regulation of PTP-1 and insulin receptor kinase by fractions from cinnamon:Implications for cinnamon regulation of insulin signalling. J Horm Res 1998; 50:177-182.
4. Bolin Qin, Kiran S. Panickar and Richard A. Anderson.Cinnamon: Potential Role in the Prevention of Insulin Resistance, Metabolic Syndrome, and Type 2 Diabetes. J Diabetes Sci Technol. 2010 May; 4(3): 685–693.
5. Altschuler JA, Casella SJ, MacKenzie TA, Curtis KM. The effect of cinnamon on A1c among adolescents with type 1 diabetes. Diabetes Care 2007;30(4):813–6
6. Blevins SM, Leyva MJ, Brown J, Wright J,Scofield RH, Aston CE: Effect of cinnamonon glucose and lipid levels in non– insulin dependent type 2 diabetes mellitus. Diabetes Care 30:2236–2237, 2007
7. Khan A, Safdar M, Khan MMA, Khattak KN, Anderson RA. Cinnamon improves glucose and lipids of people with type 2 diabetes. Diabetes Care 2003;26:3215–18.
8. Mang B, Wolters M, Schmitt B, Kelb K, Lichtinghagen R, Stichtenoth DO, Hahn A: Effects of a cinnamon extract on plasma glucose, HbA1c, and serum lipids in diabetes mellitus type 2. Eur J Clin Invest 36: 340– 344, 2006
9. Meir Mizrahi, Gadi Lalazar, Tomer Adar, Itamar Raz, and Yaron Ilan. Assessment of insulin resistance by a 13C glucose breath test: a new tool for early diagnosis and follow-up of high-risk patients. Nutr J. 2010; 9: 25.
10. Mohammadreza Vafa, Farhad Mohammadi, Farzad Shidfar, Mohammadhossein Salehi Sormaghi, Iraj Heidari Effects of Cinnamon Consumption on Glycemic Status, Lipid Profile and Body Composition in Type 2 Diabetic Patients, Int J Prev Med. 2012 August; 3(8): 531–536.
11. Akilen R, Tsiami A, Devendra D, Robinson N. Glycatedhaemoglobin and blood pressurelowering effect of cinnamon in multi-ethnic type 2 diabetic patients in the UK: a randomized, placebo-controlled, double-blind clinical trial. Diabetic Medicine 2010;27(10):1159–67.
12. Rosado J. A Study to Determine the Effects of Cinnamon on Blood Glucose and Lipid Levels in Persons with type-2 Diabetes [dissertation]. Honolulu: University of Hawaii at Manoa, Honolulu, 2010.
13. Cheng DM Kuhn P, Poulev A, Rojo LE, Lila MA, Raskin I. In vivo and in vitro antidiabetic effects of aqueous cinnamon extract and cinnamon polyphenol-enhanced food matrix. Food Chem. 2012Dec 15;135(4):2994-3002.
14. Boqué N, Campión J, de la Iglesia R, de la Garza AL, Milagro FI, Román BS, Bañuelos O et al. Screening of polyphenolic plant extracts for anti-obesity properties in Wistar rats. J Sci Food Agric. 2012 Aug 21
15. Vanschoonbeek K, Thomassen JW, Senden JM, Wodzig WKWH, van Loon LJC. Cinnamon supplementation does not improve glycemic control in postmenopausal type 2 diabetes patients. The Journal of Nutrition 2006;136: 977–80.
16. Jeff Wang. The effect of cinnamon extract on insulin resistance parameters in polycystic ovary syndrome: a pilot study. Fertility and Sterility_ American Society for Reproductive Medicine 2007; 88:140-143
|
 IJCRR
IJCRR 


 This work is licensed under a Creative Commons Attribution-NonCommercial 4.0 International License


