IJCRR - 5(5), March, 2013
Pages: 17-42
Date of Publication: 22-Mar-2013
Print Article
Download XML Download PDF
CLIMATOLOGY AND COMPARISON STUDY OF STRATOSPHERE AND LOWER MESOSPHERE TEMPERATURES USING SATELLITE AND REANALYSIS DATA SETS.
Author: G. N. Madhavi, P. Kishore, S.V.B. Rao, Isabella Velicogna, V. Sivakumar
Category: General Sciences
Abstract:In this paper, GPS RO stratospheric temperatures are compared with different satellite and different model data sets. The data sets used for comparison include Japanese 25-year Reanalysis (JRA-25), UK Met office (MetO), ERA-Interim, GEOS5, and satellite temperatures are AIRS_Aqua, HIRDLS, Aura_MLS and SABER. Apart from the comparison, we also studied the seasonal variation of temperature during summer and winter in both the hemispheres. The seasonal and latitudinal variation of temperature by GPS (CHAMP+COSMIC) with other reanalysis (JRA-25, GEOS5 and METO) and satellite measurements (AURA_MLS and SABER) for both the hemispheres show reasonably good agreement. The difference of about \?0.5 to \?0.75 K is observed at 20 km, \?1K to \?1.75K at 35 km while the high values of ~3 to 4 K are observed at upper stratosphere and lower mesosphere height regions (50 km to 60 km). The GPS RO temperatures above 35 km are noticed to be warmer than reanalysis and satellite data sets in SH region. This tendency increases with increasing height and reaches its maximum at 60 km, with magnitude of 3 K to 4 K with reanalysis data sets and 2 K to 3.5 K with satellite measurements. The calculated SAO and AO amplitudes based on GPS data are found to be comparable with the earlier results.
Keywords: Middle atmosphere; Global climate, Stratosphere, Temperature Profile.
Full Text:
INTRODUCTION
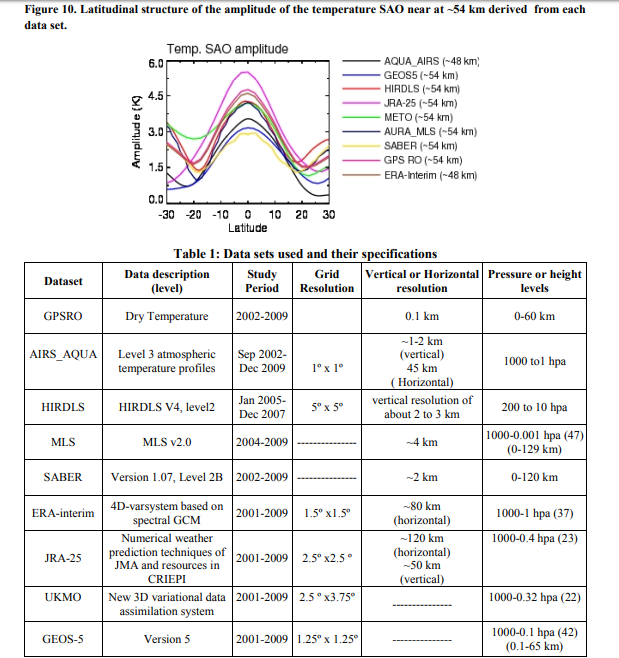
Temperature is one of the important factor which influences the global climate change and dynamics of the middle atmosphere especially in the stratosphere and lower mesosphere region. It is a region which affects the weather systems in the lower atmosphere as well as upper atmosphere. Stratospheric temperature changes are also crucial for understanding its variability and trends, including predicting future changes (World Meteorological Organization (WMO), 2006). Due to lack of observational data, this part of the atmosphere provides a long list of challenging scientific problems, which includes variations in stratospheric ozone concentrations and its thermal structure. The middle atmosphere climatologies were first studied in 1964 and 1972 by Committee on Space Research (COSPAR) Reference Atmospheres using interpolation of single station balloon and rocket data (Randel et al., 2004). Later on a wide variety of observational techniques have been used to measure temperature in the stratosphere and their variations in time and space. These techniques include balloon soundings (e.g. Kitamura and Hirota, 1989; Tsuda et al., 1991), rocketsonde measurements (e.g. Dewan et al., 1984; Eckermann et al., 1995; Hamilton, 1991), and LIDAR (e.g. Hauchecorne and Chanin, 1980; Chanin and Hauchecorne, 1991; Wilson et al., 1991; Whiteway and Carswell, 1994; LeBlanc et al., 1998; Sivakumar et al., 2003) etc, with limited period of observations. The rocket data are useful, as they are the only observations of the 30 80 km region prior to the LIDAR observations. However, determining quantitative trends or long term observations from rocket data is complicated as measurements are made through different types of sensors leading to instrumental changes and also due to the corrections made to the data in order to account for aerodynamic heating (Dunkerton et al., 1998). As rocket data are available only at few locations around the globe, there is a difficulty for establishing climatology over a global scale, despite the good results from many of the ground based and space borne instruments (Steiner and Kirchengast, 2000). To overcome the lack of observational data and to establish the climatology over a global scale, the scientific problems regarding middle atmosphere climatological data sets have been studied by World Climate Research Programme (WCRP) under Stratospheric Processes and Their Role in Climate (SPARC) project. An inter comparison study based on different kinds of middle atmosphere tempearature measurements by Randel et al., 2004 suggest that most of the data sets exhibits warm bias of more than ~5K in the stratosphere and these type of studies are useful to identify the biases in particular data sets and to highlight regions where large differences are found among several data sets. Recently, Global Positioning System (GPS) Radio occultation (RO) observations started offering several important and unique features complementary to other methods of observing the Earth’s atmosphere. The GPS RO technique has the advantage of global coverage, high accuracy, high vertical resolution (less than 1 km), long term stability, self calibration and capability to operate in all weather conditions (Kursinski et al., 1997; Wickert et al., 2001; Hajj et al., 2002). It provides a powerful tool for atmospheric sounding, which requires no calibration, not affected by clouds, aerosols or precipitation, and provides an almost uniform global coverage with vertical profiles of atmospheric air density, temperature, and water vapor as well as ionospheric electron density (Hajj et al., 2004; Wickert et al., 2004). Several investigators validated the GPS measurements and have concentrated in the height region between 8 and 30 km (Hajj et al., 2004; Wang et al., 2004; Kishore et al., 2009), though the data was available up to 60 km. Ho et al, 2007 compared lower stratosphere microwave Brightness Temperatures (TB) with the GPSRO data from CHAMP during June 2001 to June 2005 and he found good agreement between the data sets. Recently, Sivakumar et al. (2011), studied and compared temperature profiles only for a southern sub tropical site Reunion (20.8 S; 55.5 E) with HALOE, CHAMP, COSMIC, and SABER temperature measurements for the height range between 30 and 60 Km and results are found to be reasonable agreement with each other with a relative difference in temperature of 6 K is observed. Similar studies of GPS measurements over stratosphere height region were not reported earlier and thus validation of GPS data sets over stratosphere height regions are necessary and more beneficial to the atmospheric researchers to improve the global model accuracy and void the observational gap in the stratosphere and lower mesosphere height region. This paper is organized as follows: In section two, we present the details about GPS (CHAMP + COSMIC) RO data sets which are used to study the monthly, seasonal and zonal mean temperature variations from 20 to 60 km height for the period 2002 to 2009. Results obtained from the present analysis in terms of comparison between COSMIC, satellite and other reanalysis data sets are described in the section 3. We shall describe the latitude height seasonal variations of temperature (both during summer and winter seasons) in both the hemispheres. The monthly mean temperatures in the equatorial, low, middle and high latitude regions in the stratosphere (lower, middle and upper height levels) at 20, 35, 45 km for all the data sets and their differences with respect to COSMIC data are given in a detailed manner. Finally, we investigate the amplitude height structures of semiannual (SAO) and annual oscillations (AO) in the equatorial region using GPS and reference data sets. The arrived conclusions from the present study are summarized in the section 4. Data Analysis: For the present study, we mainly used GPS RO (Rocken et al., 1997) data from CHAMP (Wickert et al., 2001) for the period May 2001 to October 2008 and COSMIC (Anthes et al., 2008) from June 2006 to December 2009. The FORMOSAT 3/COSMIC is a joint Taiwan – US mission and the satellite was launched successfully on 15 April 2006, named COSMIC – Constellation Observing System for Meteorology, Ionosphere and Climate. This mission provided an innovative use of GPS RO data for atmospheric and ionospheric research, for improving global weather forecasts and climate change related studies. A distinctive feature of the COSMIC mission, compared to previous RO missions, is tracking both setting and rising neutral atmospheric occultations in the lower troposphere in an open loop (OL) mode (Schreiner et al., 2007). The GPS RO dry temperature data product is used, which is derived from the measured refractivity profile by neglecting humidity and as such is accurate above 10 km in the tropical region. The original GPS data are available at 0.1 km vertical resolution but they have an effective vertical resolution of the order of 1 km in the upper troposphere and stratosphere region. In addition, we also make use of several other data sets for comparison purpose. In the following, we present short descriptions of the reference datasets included in the comparisons. These are intended to be brief, and more details for each dataset can be found in the referred publications and the specifications of the data sets used are given in Table1. The additional data base includes data from other satellites like the Atmospheric Infrared Sounder (AIRS)/advanced Microwave Sounding Unit (AMSU), a sounding system on the National Aeronautics and Space Administration (NASA) Aqua mission, which uses the most advanced temperature humidity sounding system ever deployed (Parkinson, 2003). AIRS data provides the vertical profiles of atmospheric temperature and water vapor with vertical resolution of ~1 2 km, horizontal resolution of 45 km, temporal resolution of twice daily. AIRS level 3 atmospheric temperature profiles from September 2002 to December 2009 are used for this study. The data have horizontal resolution of 1º by 1º for longitude Vs latitude grid, and the vertical levels are available at standard pressure levels from 1000 to 1 hPa and the temperature uncertainties of ± 1 K at 1km (Murthy G. Divakarla et al., 2006; Sica et al., 2007). The High Resolution Dynamics Limb Sounder (HIRDLS) on the NASA EOS Aura satellite, the vertical projection of the field of view at the limb is ~1 km (Gille et al., 2008; Alexander et al., 2008). Oversampling by a factor of 4 5 gives the potential vertical resolution less than 1 km. The horizontal along track sampling is approximately 1 degree (75 100 km) along the measurement track, but is normally longitude at 24.72, and it is near to the equator. The longitudinal sampling is much higher near the turn around latitudes of the HIRDLS measurement track, which are near 80 N and 64 S. HIRDLS V4 level 2 daily temperature data sets during January 2005 to December 2007 are utilized for this study. Microwave Limb Sounder (MLS) on the AURA satellite measures ~3500 vertical profiles per day along the suborbital track. The vertical resolution of MLS v2.0 temperature is ~4 km in the stratosphere and precision is typically ~1 K at the stratosphere height region (Froidevaux et al., 2006; Schwartz et al., 2007). MLS data sets are used for this study from 2004 to 2009 and each profile up to ~160 km along the orbit tracks, to 82 degree in each hemisphere. The SABER temperature data used are version 1.07 of the level 2B product from the year 2002 to 2009 with an effective vertical resolution of ~2 km (Remsberg et al., 2003). SABER is located on NASA TIMED spacecraft and the latitude range of the observations is from 53 in one hemisphere to 83 in the other; about every 60 day, the latitude coverage of SABER flips to the opposite hemisphere. The uncertainty is in the order of 1 3 K in the lower stratosphere, ~1 K near the stratopause and around ~2 K in the mesosphere and lower thermosphere region. ERA Interim uses a 4 D var system based on a spectral GCM (Simmons et al., 2005). ECMWF collect various data sets from organizations worldwide for use in the assimilation activity (Uppala et al., 2005). The atmospheric data are available on 1.5 x 1.5 grids on 37 pressure levels from 1000 to 1 hPa. The main advances in ERA Interim system are: T255 (~80 km) horizontal resolution, better formulation of background error constraint, new humidity analysis, improved model physics, quality control of data drawing on experience from ERA 40, variational bias correction of satellite radiance data (Simmons et al., 2007b; Dee and Uppala, 2009; Uppala et al., 2009). For the present study purpose, we used the ERA Interim temperature data sets from 2001 to 2009. The JRA 25 data sets are constructed using the operational numerical weather prediction (NWP) techniques of the JMA and computational resources in CRIEPI (Onogi et al., 2007). JRA 25 reanalysis is a basic meteorological grid point data set with uniform resolution of 120 km in the horizontal and from the surface to about 50 km in the vertical. JRA 25 provides over 200 meteorological parameters globally with 23 vertical levels from 1000 hPa to 0.4 hPa and the resolution of 2.5 x 2.5 grids in longitude/latitude wise. The temperature data uses from 2001 to 2009 for the present study. Data assimilation system has been developed at the UK Meteorological Office (UKMO) to analyze the various observations available in the troposphere and stratosphere, and it is referred as MetO. The MetO data incorporates the measurements from different satellite, radiosondes, and aircraft data into a numerical forecasting model (Swinbank et al., 1998). Since November 2000, the MetO fields have been produced using a new 3D variational data assimilation system (Lorenc et al., 2000), and one important change is that satellite radiance measurements were assimilated directly rather than using retrieved temperature profiles. The analysis consist of temperature, wind components, and geopotential heights on a global grid of resolution 2.5x3.75 degree (latitude/longitude) at 22 vertical pressure levels from 1000 to 0.32 hPa. GEOS5 model, derived from the National Aeronautics and Space Administration (NASA) Goddard Earth Observing System general circulation model, Version 5 (GEOS5) (Sobel et al., 2007). GEOS5 analyses are produced using the grid point Statistical Analyses method (Kleist et al. 2009; Cullather and Bosilovich, 2011), a three dimensional variational assimilation system, with a 6 hour analyses window. The meteorological parameters are available on 1.25 x 1.25 grid on 42 pressure levels from 1000 hPa to 0.1 hPa, which corresponds to the height range from 0.1 to 65 km. For the present study, we have used the temperature data sets from 2001 to 2009. Here we used several satellite and model datasets. These data sets are different spatial and height resolutions. For all the data sets, monthly mean profiles were interpolated over 500 m with 10 x 10 longitude, latitude resolution thus taking the data analysis and the comparisons between the instruments easier.
RESULTS AND DISCUSSION
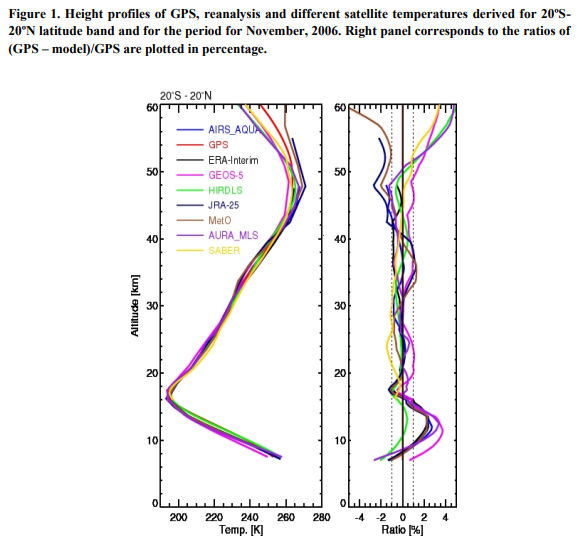
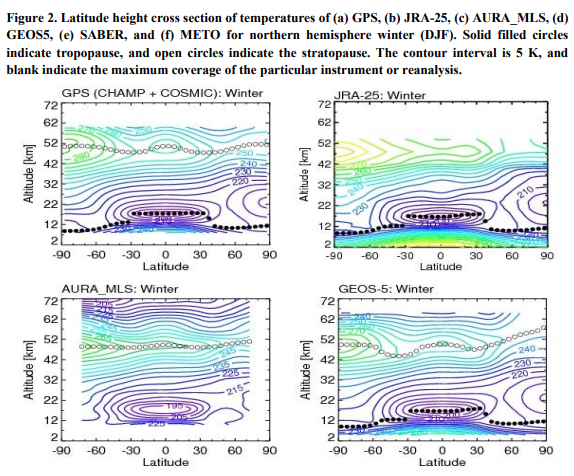
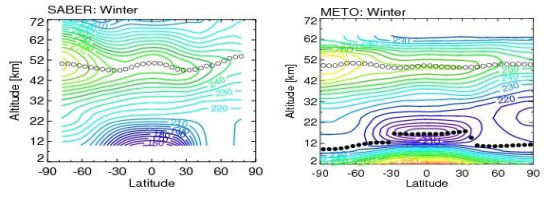
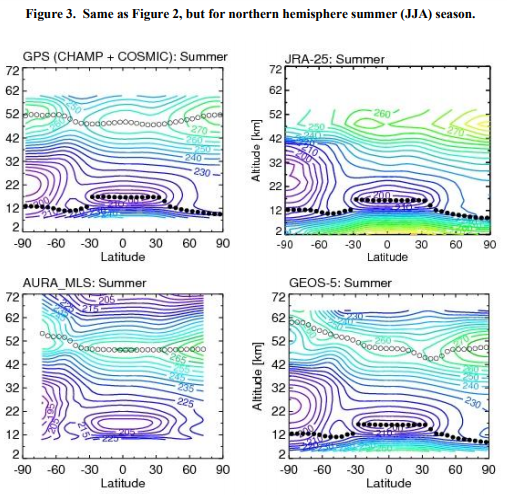
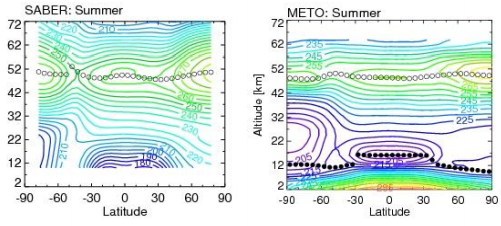
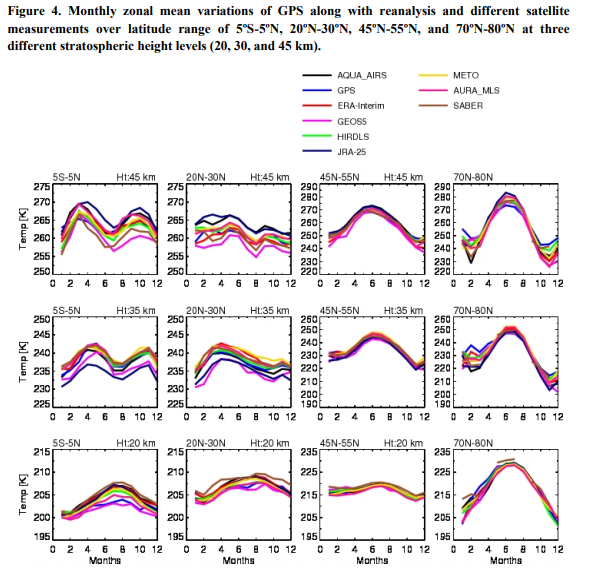
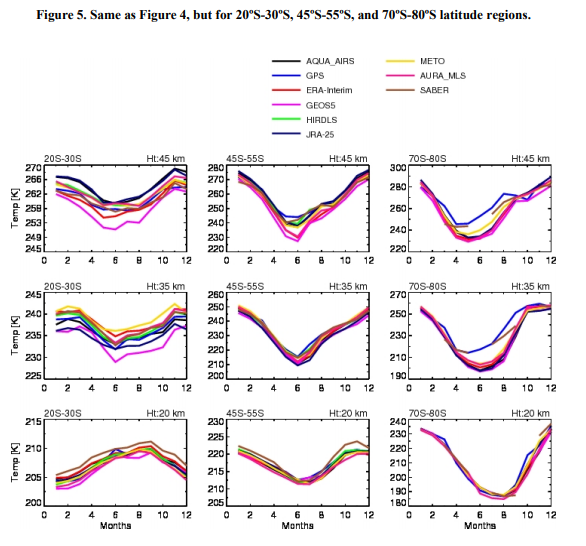
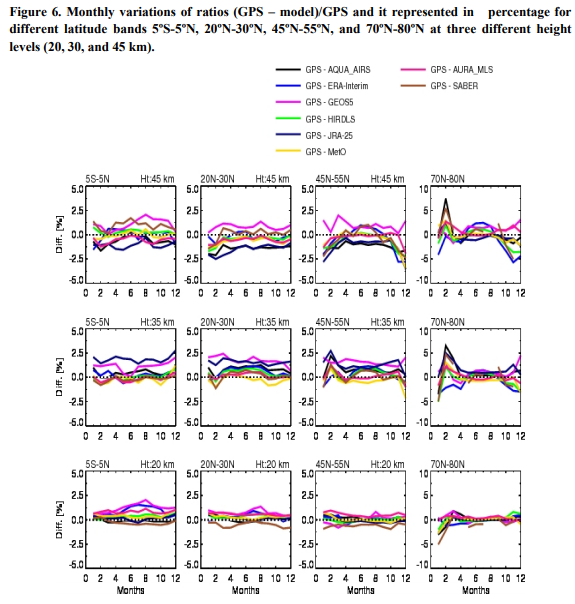
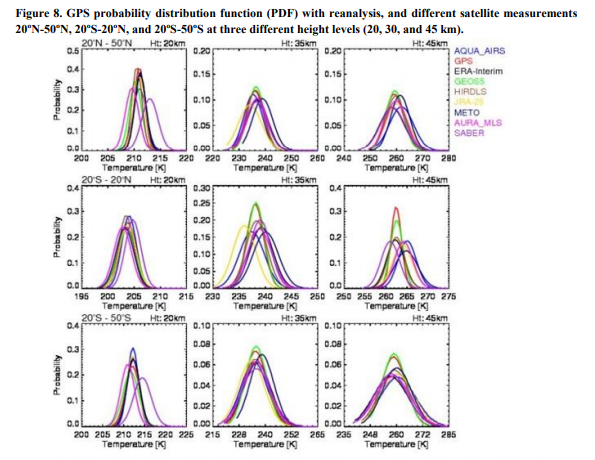
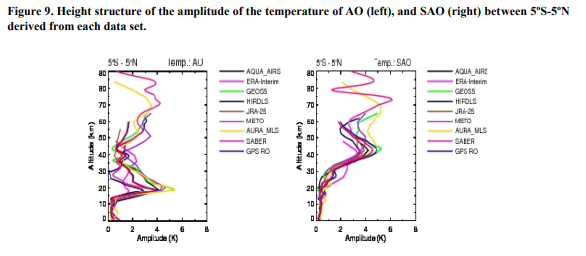
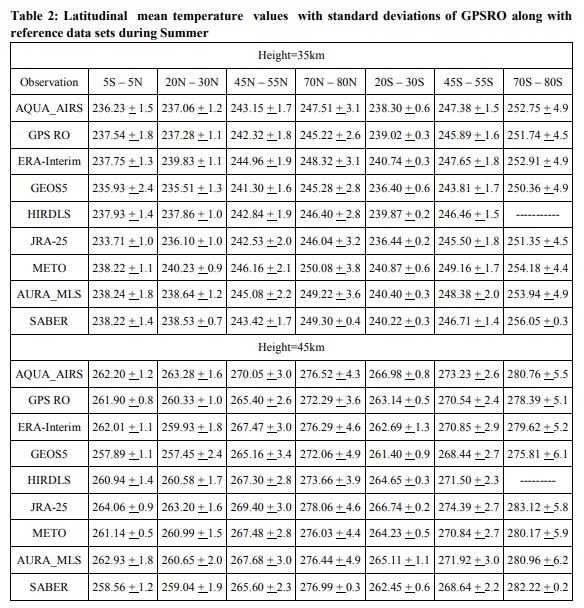
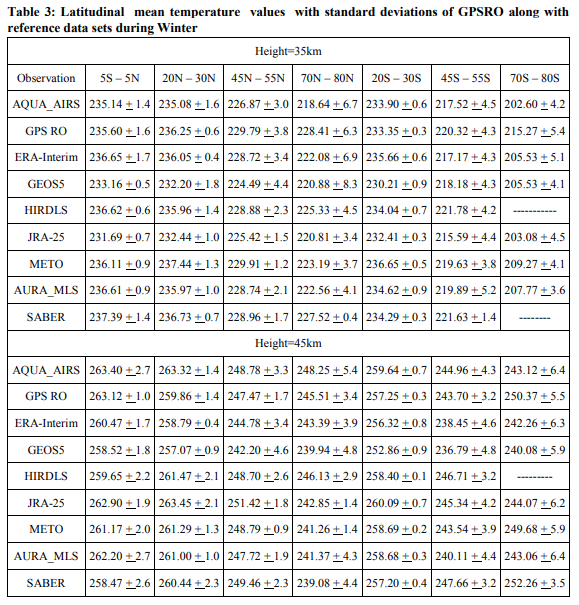
Comparison of temperature measurement by GPS with re-analyses and Satellite data sets: Figure 1(a) represents the vertical profiles of temperature from the GPS RO, different satellite measurements and reanalysis data sets from 8 to 60 km. Here, we considered the equatorial region between 20 –20 N for November 2006. The vertical mean temperature profiles of the COSMIC and other measurements were similar except at the stratopause height region. Below 8 km height, we found large difference in the measurements due to the presence of water vapor and the temperature retrieval might be erroneous at these heights. Hence, we have restricted our comparisons to height range between 10 km to 60 km. The relative percentage of differences between GPS and reanalysis/satellite data sets are shown in Figure 1(b). The mean differences between GPS RO and other measurements at most of the individual heights vary between 1 K to 2.5 K (~1 %) in the 20 km to 50 km height region, and the mean differences ~4 K to 5 K (~2 2.5%) found in the upper stratosphere and lower mesosphere region. Such differences observed between GPS and satellite measurements might be due to difference in sampling, technique employed, observational time and atmospheric tidal disturbances. An inter comparison study by Randel et al. (2004) based on different kinds of middle atmosphere temperature measurements also showed that the rocketsonde measurements were warmer (~45 – 70 km) than the ground based and Satellite measurements (NCEP, ERA 40, MetO, CIRA 86, HALOE and MLS). It was also showed (Tsuda et al., 2000) that in the stratosphere, there were significant temperature fluctuations, which were probably caused by atmospheric waves which produce periodic differences between GPS/MET and radiosonde profiles. Recently Sivakumar et al. (2011) compared the Reunion Lidar measurements with COSMIC temperatures and they found the differences of 5 K. Latitude-height variability of temperature: Here, we would like to describe the latitude height cross section of temperatures derived from GPS RO measurements and comparison with the reanalysis data sets; JR 25, MetO, and GEOS 5 along with satellite measurements of MLS and SABER data sets during Northern hemisphere (NH) winter (Dec, Jan and Feb). Figure 2(a f) represents the longitudinal mean temperature (during winter) contours of GPS RO, MLS, SABER, JRA 25, GEOS 5 and MetO data sets respectively. We have restricted to some of the data sets, due to limitations regarding the coverage and height coverage of satellite and model data sets. The data sets used in this study have been obtained at standard pressure levels, and interpolated to 5 degree latitude grids at 0.5 km height resolution. Describing the features, it can be seen that the temperature structure of the GPS RO and other data sets looks similar. It is evident from the figure that a clear noticeable difference for NH high latitude region (70ºN – 90ºN) by the MetO, the stratopause temperature is 3 to 4 K warmer than GPS and is reverse (colder) when compared with GEOS5. As expected, the maximum temperatures are observed at stratopause height (~50 km) in all data sets. The maximum temperature at southern polar region is close to 285 K (+12 C) whereas the temperature at Northern Polar region is about 30 K lower (Note that the southern winter corresponds to the northern summer and vice versa). In figure 2, we have superimposed the tropopause (filled circles) and stratopause (open circles) for all the selected latitude ranges (5º bin). In the case of MLS and SABER, temperature data sets are reliable only above 10 km, so we have not presented the tropopause temperature for these data sets. Tropopause is identified based on lapse rate definition (WMO (1957)), and stratopause is defined as the height at the warmest temperature observed between 40 and 60 km. It is found that the tropopause height reached maximum in between 30 30 N and decreases with latitude and observed minimum in polar region. Kishore et al. (2006) reported the longitude latitude structures of tropopause temperature and height based on GPS CHAMP and SAC C measurements. The winter stratopause at high latitudes exhibits an increase in height and temperature with increasing altitude. Over the NH winter the stratopause height is found ~50 km at equator (5 N). At latitudes greater than 5 S the stratopause height decreases slowly and reaches ~47 km at 30 S and it starts increasing slowly and reaches the stratopause height ~50.5 km at 70 S. A mirror image of this pattern can be seen at NH side. Such type of stratopause height pattern is not always seen clearly by the MetO observations. The meridional temperature structure generated by the GPS RO, satellite and reanalysis values for the NH summer (June, July and August) is shown in Figure 3a f. In the low to middle latitude (60ºS 60ºN), and between 10 km to 45 km, the GPS temperatures are in good agreement with those reference data sets. The global mean differences of GPS with reference data set comparisons are less than 0.5 to 2.0 K, and the standard deviations are estimated as ~1 to 2.5 K. The difference increases with increasing latitude and height. The differences for the GPS, GEOS5, and GPS, METO, is observed to be 2 to 3.5 K between 60S 90S in between 45 to 50 km height region. Wang et al.(2004) compared Michelson Interferometer for Passive Atmospheric Sounding (MIPAS) data with several other data sets and they found that the temperature bias are higher than ECMWF but lower than MetO, the differences are found to be ~1.5 K in between 30 and 45 km. Between 45 and 50 km, they observed that MIPAS is colder than both ECMWF and MetO by 2 to 3 K and 3 to 5 K, respectively. They also suggested that the large discrepancies between MIPAS and analysis above 30 km likely due to deficiency in the underlying general circulation models. Looking at the temperature in the polar region, we can infer that the Arctic temperature is about 279 K at around 51.5 km, whereas it is close to 276 K at 52 km in the Antarctica region. From the Figure 3, at the summer pole it is evident that the cold Tropopause with minimum temperature is observed while it shows the warm stratopause with maximum temperatures. Between 5ºS 5ºN, the stratopause altitude reaches about 48.5 km, and at the sub tropics the mean height decreases to about 47.5 km in GPS RO measurements. The strongest gradient in stratopause height occurs over latitude range of 70 –90º in both the hemispheres with mean height increasing to 52 km at polar latitudes. The high latitude SH summer stratopause is ~6 K colder than the high latitude NH summer stratopause. It is clear from the figure 3 that the stratopause heights looks similar in all data sets at northern polar latitudes, whereas in the southern polar latitudes, it varies and the maximum stratopause height reaches at around ~60 km in the GEOS5 data sets. Figure 4 compares the monthly and seasonal variations of satellite and model/Reanalysis between 5 N, 20 30 N, 45 55 N, and 70 80 N at three different stratospheric heights (20, 30, and 45 km). Here, we have zonally averaged temperature data over 10 degree latitudinal bands for the NH. The temperature pattern measured by both satellite and model data sets are similar. The equatorial region (5ºS 5ºN) clearly shows semi annual oscillations with maximum peaks during March and October months. Leblanc et al. (1998b) showed semi annual oscillations with maximum at the equinoxes in March/April and September/October at 19.5ºN using long term lidar measurements. Comparing COSMIC with satellite measurements in winter season, we found satellite measurements are higher in 20, and 35 km heights, and is found to be opposite at 45 km, i.e., COSMIC temperatures are higher than satellite measurements. In mid and high latitude regions, from all the measurements the temperature structure shows annual oscillation between 20 and 45 km height level with maximum during May to July. Similarly, several investigators noted strong annual oscillations with a maximum during April to July (Hauchecorne et al., 1991; Gobbi et al., 1995; Gerding et al., 2008; Schoch et al., 2008). Figure 5 shows the monthly and seasonal variations of satellite and model data sets of three different latitude bands (20ºS 30ºS, 45ºS 55ºS, and 70ºS 80ºS) of southern hemisphere at three different (20, 35, and 45 km) height levels. The overall monthly structure is found to be similar in each data set. From the figure, one can infer that the annual oscillation dominates in the Southern hemisphere (SH) winter season. Monthly average temperatures of 20 30 S latitude at 20 km height level shows the annual oscillation peak observed during September month. COSMIC monthly temperatures are colder in winter southern hemisphere at high latitude region (70ºS 80ºS). As we expect, the specific humidity observations show the largest differences at high latitudes. We have also compared the results at different latitude bands of NH and SH (5ºS 5ºN, 20ºN 30ºN, 45ºN 55ºN, 70Nº 80ºN, 20ºS 30ºS, 45ºS 55ºS, and 70ºS 80ºS) at 35 km and 45 km height levels of GPS with reference mean temperature (along with standard deviations) data sets. The differences in values are summarized in Table 2 and 3, respectively for summer and winter season. It is inferred from the tables, that the NH winter standard deviations are found higher than NH summer, especially at high latitude regions. ERA Interim, JRA 25 temperature values for low and mid latitude region (45ºN 45ºS) are better than GEOS5 and MetO data sets. On the other hand, COSMIC monthly mean temperatures looks similar except there are few differences at some polar latitudes and lower mesospheric height levels, for both the hemispheres. For quantitative purpose, we have estimated the relative mean differences (100*(GPS – reference data)/GPS) of temperature of COSMIC with satellite and model data sets which are shown in Figure 6 for NH and Figure 7 for SH. Between 35 and 45 km, GPS temperatures are colder than the ERA Interim but warmer than GEOS5 by 1.5 to 2 K. The larger discrepancies in the peak around 35 km and occur around the 20ºN 30ºN, 20ºS 30ºS and polar region in both hemispheres. The ERA Interim temperatures are generally quite accurate below 10 hPa (~32 km) where bias in the assimilating model is relatively low and the assimilation are based on both radiosonde and satellite radiance data (Simmons et al., 2005). The largest differences occur in the mid and high latitudes in NH winter months. In particular, the ERA Interim, AQUA_AIRS, and AURA_MLS data are the coldest and agree best with COSMIC, where as JRA 25, MetO, GEOS5, HIRDLS, and SABER data have a consistent warm bias of ~2 3%, and GEOS5 shows warmest ~5% at high latitude regions. Figure 7 shows the ratios of seasonal cycle of three different heights (20, 35 and 45 km) at three different SH latitudes (20ºS 30ºS, 45ºS 55ºS, and 70ºS 80ºS). The ratios are less at lower stratospheric height level in SH, and ratios increases with increasing height level. In the case of SH, the ratios are more at winter months than the summer months, especially in the mid and high latitudes. The positive/negative ratio indicates the COSMIC is warmer/colder than the model or satellite data sets. The NH ratios lie within ± 2.5% in all latitude bands, except 70ºN 80ºN at all height levels where the differences are higher (some cases above 5%). The monthly temperature ratios in mid latitude (45ºS 55ºS) at 45 km height level, GEOS5 and AURA_MLS data exhibit cold biases upto ~5% in the mid latitude (45ºS 55ºS) at 45 km, maximizing during winter in SH. Aside from GEOS5, and AURA_MLS, the other climatologies agree to approximately 2%. Most satellite and analyses are colder than COSMIC during SH winter in mid and high latitudes at 35 km and 45 km height levels. Similar comparisons and results for CPC (Climate Prediction Center) ,UKTOVS (Met Office Analyses of TOVS Data) , CIRA86 (COSPAR International Reference Atmosphere, 1986 ), MLS (Micro wave Limb Sounder) and other data sets data have been seen by Manney et al. (1996) and found warm biases (~3 7K) over much of the stratosphere (20 50km). Recently, Randel et al. (2004) compared number of stratospheric climatologies and they have mentioned ECMWF reanalysis data found to be the coldest of all data sets between 35 and 45 km. Similarly, Schollhammer et al. (2003 a, 2003b) also showed that the largest deviations at about 5 K at 10 hPa between ECMWF and MetO analyses data sets. At upper levels at 45 km and above, COSMIC is warmer than reference data sets by 3 4 %, especially at mid and high latitude regions of SH region. The ECMWF temperatures are known generally to be quite accurate below 10 hPa (~30 km) where bias in the assimilating model is relatively low nd both radiosonde and satellite radiance data are assimilated (see e.g., Simmons et al., 2005), although problems at higher levels are prone to spread downward below 10 hPa in polar region. The maximum percentage of ratios are observed at 70ºS 80ºS latitude band at 35 km and 45 km height levels at about 8 to 10% and it indicates that COSMIC values are warmer than the model and satellite measurements. The warm bias above 30 hPa depends on the smoothing of bending angle and the interpolation procedure for the downward integration of the refractivity profile (Wickert et al., 2002). In mid and high latitudes, COSMIC temperatures at stratospheric height regions are well correlated with all the data sets in NH than the SH latitude regions. In general, the relative differences are larger in winter than in summer SH. In particular, differences found to be larger (perhaps 10 to 12 K locally) during dynamically active winter periods such as stratospheric warming (Swinbank and O’Neill, 1994). The agreement between GPS with reference data sets is quite reasonable except at high latitude regions of NH and SH. Data assimilation systems are constructed from conventional meteorological measurements in the troposphere and lower stratosphere, and nadir sounding satellite instruments like ATOVS (Advanced Tiros Operational Vertical Sounder) and HIRS (High resolution Infrared Radiation Sounder) onboard the operational polar orbiting NOAA (National Oceanic and Atmospheric Administration) satellites. The radiosonde measurements only cover limited area and even the distribution of the radiosonde stations is rather inhomogeneous. Especially, the atmosphere over the oceans and a wide region in the SH are not covered by the radiosondes. In addition, instrumental changes are a particular source of problems (Seidel et al., 2004), but can often be identified readily by sharp discontinuities in the record (Angell, 2003; Rosenolf and Reid, 2008). The satellite data sets exhibit broad vertical weighting functions in the stratosphere, providing a low vertical resolution of the order of several km only. The vertical resolution is depends on the satellite viewing orbital geometry, along the vertical scan. On the other hand, GPS RO data for temperature measurements which may also be affected by ulti path effects, non spherical symmetry of the Earth’s atmosphere of uncertainties in the ancillary temperature fields used in the retrieval (Rocken et al., 1997). Probability Distribution Function: Monthly variations of temperature at different latitudinal bands at different height levels of all the data sets are discussed in earlier sections. To evaluate consistency between the data sets regardless of co location in space and time, the best way is calculating the probability distribution function (PDF), and is shown in Figure 8. The distributions are represented at three different bands and it covers up to mid latitudes of NH and SH at three different stratospheric heights. In equatorial region (20ºS 20ºN), the distribution peaks are similar in the stratosphere lower height (20 km), and at 35 km height level the peaks are centered in between 236 K to 240 K, and 262 K to 266 K at 45 km height level. SABER measurement illustrates peaks at 20 km height level with the values are bit lower than the satellite and model data sets in all latitude bands. Annual and Semi annual oscillations: Middle atmospheric dynamics is strongly controlled by long period of oscillations, e.g., annual oscillation (AO) and semi annual oscillation (SAO) other than short period gravity waves, planetary waves and atmospheric tides. Seasonal temperature variations in the tropics are dominated by SAO, and the existence of a SAO in the tropical stratosphere was first documented by Reed (1962) based on the tropical temperatures in the lower stratosphere he noted the SAO above 50 mb. Here, we have calculated the temperature amplitudes of AO and SAO at every height level over latitude range of 5 S and are shown in Figure 9(a) and 9(b) for the different satellites and model data sets. Within about 5º of the Equator, our results for both AO and SAO show that there are small changes in the amplitude as function of height. In lower stratosphere, the AO shows a peak near 20 km with the value at about ~4.5 K. The maximum AO amplitude is about ~5 K in AURA_MLS and GEOS5 data sets, and is less for ERA Interim reanalysis data sets. For the equatorial SAO, there are peaks in amplitude near 45 km, with a magnitude range of 3.5 K to 5 K, and another dominant peak at 70 km height level, with a magnitude of 5 K to 6 K. It is well documented by the previous researchers (e.g. Hirota, 1980 ; Randel et al., 1994) that the SAO temperature has a double peak structure in height, with first maxima in stratosphere (~45 km) and second maxima in mesosphere (~70 km). The maximum amplitudes of SAO are observed near at 45 km, which are greater than 4 K in AQUA_AIRS, GPS, GEOS5 and AURA_MLS, and weaker amplitudes at JRA 25, ERA Interim, MetO, HIRDLS and SABER observations. Hirota et al. (1980), observed SAO temperature amplitudes of ~4 K using different data sets near 45 km, and another maximum near about 70 km with a range of amplitudes ~4 K to 7 K, which is comparable to our results. Huang et al. (2006), estimated SAO amplitudes using SABER data sets, and have also observed the amplitude peaks near 40 km and 75 km. Figure 10 shows the amplitude structure of the SAO temperature as a function of latitude as derived from the different data sets. The SAO amplitudes are estimated at 54 km for each data set, except AQUA_AIRS, and ERA Interim data sets upto 48 km height level. From the figure, it can be noticed that the SAO amplitude has a strong latitudinal variation, showing peak at the Equator. The maximum amplitudes are observed at equator at about 5 K in MetO data sets, approximately twice as large as the SABER SAO amplitudes. Huang et al. (2006) derived the SAO amplitudes based on SABER measurements, covering over 3 years (2002 2004). The results are presented from 15 to 95 km and latitude ranges from 48ºS to 40ºN and they observed SAO maximum in the equator at about 5 K. Generally the amplitude of the SAO decreases with increase in the latitude, but can recover in the subtropics depending on height. In this regard, the semi annual oscillation exhibits a latitudinal asymmetry, with higher amplitudes in the Southern Hemisphere subtropics (Belmont and Dartt, 1973; Ray et al., 1998). Reed (1962) also found the existence of a semi annual oscillation in the temperature at some stations nearer to the equator: the oscillation had its maximum amplitude over the equator. SUMMARY AND CONCLUSIONS In this paper, we reported the ability of using stratospheric temperatures from GPS RO (CHAMP+COSMIC) and the measurements are compared with several reference data sets, including assimilation analyses of ERA Interim, JRA 25, GEOS5 and MetO, satellite observations of AIRS_AQUA, AURA_MLS, SABER, HIRDLS. The temperature data for the stratosphere and lower mesosphere heights (20 60 km) are considered in the present study. The latitude height temperature structures by GPS (CHAMP+COSMIC) with reanalysis data sets (JRA 25, GEOS5 and METO) and satellite measurements (AURA_MLS and SABER) for the northern summer and winter seasons shows very good similarities in most of the regions. The mean values and standard deviations of different latitude bands at different height levels for summer and winter seasons are summarized in Table 2 and 3 respectively. Between 20 and 30 km, GPS RO temperatures show good agreement with the different reference data sets. The mean differences averaged over the height interval are within ± 0.5 K for comparison with reference data sets. The mean differences are within ±0.5 K to ±0.75 K for 20 km, ±1 K to ±1.75 K at 35 km and ±2 K to ±2.5 K at 45 km for all the measurements. Also, large mean differences of ~3 to 4 K or more are observed in the height region between 50 km and 60 km. The GPS RO temperatures above 35 km are noticed to be warmer than references data sets in SH region. This tendency increases with increasing height and reaches its maximum at 60 km, with magnitude of 3 K to 4 K with reanalysis data sets and 2 K to 3.5 K with satellite measurements. Although good agreement was found between GPS RO and several reference data sets, there are some differences in upper stratosphere and lower mesosphere, especially at polar regions. These differences are could be due to the effect of spatial temporal mismatch between the measurements GPS RO temperature analysis algorithms, the difference in sampling data between space based and reanalysis data sets, as well as the larger uncertainties at the higher heights are the major possible reasons for the differences observed. The different vertical resolutions of the temperature measurements may also have their contributions to the differences calculated by interpolating the data on to a common grid. Monthly temperature variations and differences in ratio of GPS RO with references data sets at different latitude bands in the NH and SH for different height levels 20 km, 35 km, and 45 km are mostly in good agreement. At extra tropical latitude (20ºS 30ºS) the temperature difference are more at 35 km and 45 km height levels than the NH extra tropical latitude region. The annual and semi annual oscillations are studied at equatorial region (5ºS – 5ºN) over height based on satellite and model observations. It was found that the measured AO and SAO amplitudes by satellite and model data sets are in reasonably good agreement with previous results. Thus, we have demonstrated the usefulness of GPS RO data for the study of global distribution of stratospheric analysis. A number of new GPS satellite missions will offer the opportunity for further enhanced space time resolution and long term RO measurements, and enrich the studies of global wave activity in the stratosphere and lower mesosphere. Incorporation of the GPS occultation data may improve the accuracy of the global and regional numerical weather forecasts and climate analysis, especially in regions lacking of observational data sets.
References:
1. Alexander, S. P., Tsuda, T., Kawatani, Y., and Takahashi, M., 2008, Global distribution of atmospheric waves in the equatorial upper troposphere and lower stratosphere: COSMIC observations of wave mean flow interactions. J. Geophys. Res, 113, D24115, 18 PP, doi:10.1029/2008JD010039.
2. Anthes, R. A., et al., 2008, The COSMIC/FORMOSAT 3 mission: Early results, Bull. Am. Meteorol. Soc, 89, 313– 333.
3. Angell, J. K., 2003, Effect of exclusion of anomalous tropical stations on temperature trends from a 63 station radiosonde network, and comparison with other analyses. J. Clim, 16, 2288– 2295.
4. Belmont, A. D. and Dartt, D. G., 1973, Semiannual variation in zonal wind from 20 to 65 kilometers at 80ºN–10ºS. J.Geophys. Res., 78, 6373–6376.
5. Chanin, M. L., and Hauchecorne, A., 1991, Lidar study of the structure and dynamics of the middle atmosphere. Indian J. Radio Space Phys, 20, 1–11.
6. Cullather, R. I. and M. G. Bosilovich, 2011, The moisture budget of the polar atmosphere in MERRA. J. Climate, 25, 5 24.
7. Dee, D. P., and Uppala, S., 2009, Variational bias correction of satellite radiance data in the ERA Interim reanalysis. Quart. J. R. Meteorol. Soc, 135, 1830 1841.
8. Dewan, E. M., Grossbard, N., Quesada, A. F., and Good, R. E., 1984, Spectral analysis of 10 m resolution scalar velocity profiles in the stratosphere. Geophys. Res. Lett, 11, 80– 83.
9. Dunkerton, T. J., Delisi, D. P., and Baldwin, M. P., 1998, Middle atmosphere cooling trend in historical data. Geophys. Res. Letts, 25, 3371 3374.
10. Eckermann, S. D., Hirota, I., and Hocking, W. K., 1995, Gravity wave and equatorial wave morphology of the stratosphere derived from long term rocket sounding. Q. J. Roy. Meteorol. Soc, 121, 149–186.
11. Froidevaux, L., et al., 2006, Early validation analyses of atmospheric profiles from EOS MLS on the Aura satellite. IEEE Trans. Geosci. Remote Sens, 44(5), 1106–1121.
12. Gerding, M., H¨offner, J., Lautenbach, J., Rauthe, M., and L¨ubken, F.J., 2008 Seasonal variation of nocturnal temperatures between 1 and105 km altitude at 54_ N observed by lidar. Atmos. Chem. Phys, 8, 7465–7482.
13. Gille, J. C., et al., 2008 The High Resolution Dynamics Limb Sounder (HIRDLS): Experiment overview, recovery, and validation of initial temperature data. J. Geophys. Res. 113, D16S43,23 PP,doi:10.1029/2007JD008824.
14. Gobbi, G. P., Souprayen, C., Congeduti, F., Di Donfrancesco, G., Adriani, A., Viterbini, M., and Centurioni, S, 1995 Lidar observations of middle atmosphere temperature variability. Ann. Geophys, 13, 648–655.
15. Hajj, G. A., Kursinski, E. R., Romans, L. J., Betiger, W. I., and Leroy, S. S., 2002, A technical description of atmospheric sounding by GPS occultation. J. Atmos. Solar Terr. Phys, 64, 451–469.
16. Hajj, G. A., Ao, C. O., Iijima, B. A., Juang, D., Kursinski, E.R., Mannucci, A. J., Meehan, T. K., Romans, L. J., de le TorreJuarez, M., and Yunck, T. P., 2004 CHAMP and SAC C atmospheric occultation results and inter comparisons. J. Geophys. Res, 109, D06109, 24 PP, doi:10.1029/2003JD003909.
17. Hamilton, K., 1991, Climatological statistics of stratospheric inertia gravity waves deduced from historical rocketsonde wind and temperature data. J. Geophys. Res, 96, 831–839.
18. Hauchecorne, A., Chanin, M. L., and Keckhut, P., 1991 Climatology and trends of the middle atmospheric temperature (33–87 km) as seen by Rayleigh LIDAR over the south of France. J. Geophys. Res, 96, 15297–15309.
19. Hauchecorne, A., and Chanin, M. L., 1980 Density and temperature pro files obtained by lidar between 35 and 70 km. Geophys. Res.Lett,7, 565–568.
20. Hirota, I., 1980, Observational evidence of the semiannual oscillationin the middle atmosphere: A review. Pure Appl. Geophys,18, 217–238.
21. Huang, F. T., Mayr, H. G., Reber, C. A., Russell, J. M., Mlynczak,M., and Mengel, J. G., 2006, Stratospheric and mesospheric temperature variations for the quasi biennial and semiannual (QBO and SAO) oscillations based on measurements from SABER (TIMED) and MLS (UARS). Ann. Geophys, 12, 2131–2149.
22. Kitamura, Y. and Hirota, I., 1989,Small scale disturbances in the lower stratosphere revealed by daily rawinsonde observations. J. Meteorol.Soc, Japan, 67, 817–831.
23. Kishore, P., Namboothiri, S. P., Igarashi, K., Sivakumar, V., Thulasiraman,S., Subba Reddy, I. V., et al., 2006, Rayleigh LIDAR observations of planetary waves in the middle atmosphere 24. over Gadanki (13.5ºN, 79.2ºE). J. Atmos. Terr. Phys, 68, 901–910.
25. Kishore, P., Namboothiri, S. P., Jiang, J. H., Sivakumar, V., and Igarashi, K., 2009, Global temperature estimates in the troposphere and stratosphere: A validation study of COSMIC/FORMOSAT 3 measurements. Atmos.Chem.Phys, 9, 897– 908.
26. Kleist, D. T., Parrish, D.F., Derber, J.C., Treadon, R., Wu, W.S., and Lord, S.,2009,Introduction of the GSI into the NCEP Global Data Assimilation System. Wea. Forecasting, 24 (6), 1691 1705.
27. Kursinski, E. R., Hajj, G. A., Hardy, K. R., Schofield, J. T., and Lin field, R., 1997, Observing Earth’s atmosphere with radio occultation measurements using the Global Positioning System. J. Geophys. Res, 102, 23429–23465.
28. LeBlanc, L. S., Mcdermid, L. S., Hauchecorne, A., and Keckhut, P., 1998, Evaluation and optimization of lidar temperature analysis algorithms using simulated lidar data. J. Geophys. Res, 103, 6177–6187.
29. Leblanc, T., Mc Dermid, L. S., Keckhut, P., Hauchecorne, A., She, C. Y., and Krueger, D. A., 1998b, Temperature climatology of the middle atmosphere from long term LIDAR measurements at middle and low latitudes. J. Geophys. Res, 103, 17191–17204.
30. Lorenc, A. C., and Coauthors., 2000, The Met. Office global three dimensional variational data assimilation scheme. Quart. J. Roy. Meteor.Soc, 126, 2991–3012.
31. Manney, G. L. et al., 1996, Comparison of UK meteorological office and US NMC stratospheric analyses during northern and southern winter, J. Geophys. Res, 101, 10, 311 10, 334.
32. Murty G. Divakarla., Chris D. Barnet., Mitchell D. Goldberg., Larry M. Mc Millin., Eric Maddy. et al., 2006: Validation of Atmospheric Infrared Sounder temperature and water vapor retrievals with matched radiosonde measurements and forecasts. J.Geophys. Res, Vol. 111, D09S15, 20PP, doi:10.1029/2005JD006116.
33. Onogi, K., Tsutsui, J., Koide, H., Sakamoto, M., Kobayashi, S., Hatsushika, H., et al., 2007, The JRA 25 Reanalysis. J. Meteor.Soc, Japan., 85, 369 43.
34. Parkinson, C. L., 2003, Aqua: An Earth ObservingSatellite Mission to Examine Water and other Climate Variables. IEEE Trans. Geosci.Remote Sensing, 41, 173 183.
35. Randel, W. J., Boville, B. A., Gille, J. C., et al, 1994, Simulation of stratospheric N2O in the NCAR 5CCM2: comparison with CLAES data and global budget analysis. J. Atmos. Sci, 51, 2834–2845.
36. Randel, W., Udelhofen, P., Fleming, E., Geller, M., Gelman, M.,Hamilton, K., Karoly, D., et al., 2004, The SPARC Inter comparison of Middle Atmosphere Climatologies. J. Climate, 17, 986–1003.
37. Ray, E. A., Alexander, M. J., and Holton, J. R., 1998, An analysis of the structure and forcing of the equatorial semiannual oscillationin zonal wind, J. Geophys. Res, 103, 1759–1774.
38. Remsberg, E., 2003, On the verification of the quality of SABER temperature, geopotential height, and wind fields by comparison with Met Office assimilated analyses. J. Geophys. Res, 108(D19), 4628 , 10 PP, doi:1029/2003JD003720.
39. Reed, R. J., 1962, Some features of the annual temperature regime in the tropical stratosphere. Mon. Weather Rev, 90, 211– 215.
40. ocken, C., Anthes, R., Exner, M., Hunt, D., Sokolovskiy, S.,Ware, R., Gorbunov, M., Schreiner,W., Feng, D., Herman, B., Kuo, Y. H., and Zou, X., 1997,Analysis and validation of GPS/MET datain the neutral atmosphere, J. Geophys. Res, 102, 29849– 29866.
41. Rosenlof, K. H., and Reid, G. C., 2008,Trends in the temperature and water vapor content of the tropical lower stratosphere: Sea surface connection, J. Geophys. Res, 113, D06107, 15PP, doi:10.1029/2007JD009109.
42. Schoch, A., Baumgarten, G., and Fiedler, J., 2008, Polar middle atmosphere temperature climatology from Rayleigh lidar measurements at ALOMAR (69 N). Ann. Geophys, 26, 1681–1698.
43. Schollhammer, K., Marquardt, C., and Labitzke, K., 2003a, Comparison of three different meteorlogical data sets (ECMWF, Met Office and NCEP), in First CHAMP Mission Results for Gravity, Magnetic and Atmospheric Studies, edited by C. Reigber, H. Luhr, and P. Schwintzer, pp. 529– 535, Springer, New York.
44. Schollhammer, K., Marquardt, C., and Labitzke, K., 2003b, Comparision of three different meteorological datasets (ECMWF, MetOffice and NCEP)and CHAMP Temperature Measurements, OIST 4 Proceedings, 4thOersted International Science Team Conference, Copenhagen June 2003, edited by P. Stauning et al., pp. 255– 260, Dan. Meteorol. Inst, Copenhage.
45. Schreiner, W., Rocken, C., Sokolovskiy, S., Syndergaard, S., andHunt, D., 2007,Estimates of the precision of GPS radio occultations from the COSMIC/FORMOSAT 3 mission. Geophys. Res. Lett, 34, L04808 , 5PP, doi:10.1029/2006GL027557.
46. Schwartz, M. J., et al., 2007, Validation of Aura Microwave Limb Sounder temperature and geopotential height measurements. J. Geophys. Res, 113, D15S11, 23 PP, doi:10.1029/2007JD008783.
47. Seidel, D. J., and J. R. Lanzante., 2004, An assessment of three alternatives to linear trends for characterizing global atmospheric temperature changes. J. Geophys. Res, 109, D14108, 10PP, doi:10.1029/2003JD004414.
48. Seidel, D. J., et al., 2004,Uncertainty in signals of large scale climate variations in radiosonde and satellite upper air temperature datasets. J. Clim, 17, 2225– 2240.
49. Sica, R. J., Argall, P. S., Shepherd, T. G., and Koshyk, J. N., 2007, Model measurement comparison of mesospheric temperature inversions, and a simple theory for their occurrence, Geophys. Res.Lett, 34,L23806, 5PP, doi:10.1029/2007GL030627.
50. Simmons, A., Hortal, M., Kelly, G., McNally, A., Untch, A., and Uppala S., 2005, ECMWF analyses and forecasts of stratospheric winter polar vortex breakup: September 2002 in the Southern Hemisphere and related events. J. Atmos. Sci, 62, 668– 689.
51. Simmons, A., Uppala, S., and Dee, D., 2007b, Update on ERA Interim. ECMWF Newsletter, 111, 5.
52. Sivakumar, V., Rao, P. B., and Krishnaiah, M., 2003, Lidar measurements of stratosphere mesosphere thermal structure over a low latitude: Comparison with satellitedata and models. J. Geophys. Res, 108, D11, 11P, doi:10.1029/2002JD003029.
53. Sivakumar, V., Vishnu Prasanth, Kishore, P., Bencherif, H., and Keckhut, P., 2011, Rayleigh LIDAR and satellite (HALOE, SABER, CHAMP and COSMIC) measurements of stratosphere mesosphere temperature over a southern sub tropical site, Reunion (20.8 S, 55.5 E): climatology and comparison study.(accepted)
54. Sobel, A. H., 2007, Simple models of ensemble averaged tropical precipitation and surface wind, given the sea surface temperature. The Global Circulation of the Atmosphere, Princeton University Press, 219–251.
55. Steiner, A. K. and Kirchengast, G., 2000, Gravity wave spectra from GPS/MET occultation observations. J. Atmos. Oceanic Tech, 17, 495–503.
56. Swinbank, R., and O.Neill, A., 1994a, A stratosphere troposphere data assimilation system. Mon.Wea.Rev., 122, 686 702.
57. Swinbank, R., and O.Neill, A., 1998, Quasi biennial and semi annual oscillations in equatorial wind fields constructed by data assimilation. Geophys. Res.Lett, 21, 2099 2102.
58. Swinbank, R., Lahoz, W.A., O’Neill, A., Douglas, C.S., Heaps, A., and Podd, D., 1998, Middle atmosphere variability in the UK Meteorological Office Unified Model. Quart. J. Roy. Meteor. Soc, 124, 1485–1526.
59. Tsuda, T., VanZandt, T. E., Mizumoto, M., Kato, S., and Fukao, S.,1991, Spectral analysis of temperature and Brunt Vaisala frequency fluctuations observed by radiosondes. J. Geophys. Res, 96, 17265– 17278.
60. Tsuda, T., Nishida, M., Rocken, C., and Ware, H., 2000, A global morphology of gravity wave activity in the stratosphere revealed by the GPS occultation data (GPS/MET). J. Geophys. Res, 105(D6), 7257–7273.
61. Uppala, S. et al., 2005, The ERA 40 re analysis. Quart. J. R. Meteorol. Soc, 131, 2961–3012.
62. Uppala, S. et al., 2009, Toward a consistent re analysis of the upper stratosphere based on radiance measurements from SSU and AMSU A. Quart. J. R. Meteorol. Soc, 135, 2086 2099.
63. Wang, D. Y., Stiller, G. P., Clarmann, T. V., Fischer, H., Lopez Puertas, M., Funke, B., 2004 , Cross validation of MIPAS/ENVISAT and GPS/CHAMP temperature profiles, J.Geophys. Res, 109, D19311, 15PP, doi:10.1029/2004JD004963.
64. Wang, D. Y., von Clarmann, T., Fischer, H., et al., 2005, Validation of stratospheric temperatures measured by Michelson Interferometer for Passive Atmospheric Sounding (MIPAS)on Envisat ,J. Geophys. Res, 110,D08301, 17PP, doi:10.1029/2004JD005342.
65. Whiteway, J. A. and Carswell, A. I., 1994, Rayleigh lidar observations of thermal structure and gravity wave activity in the high Arctic during a stratospheric warming, J. Atmos. Sci, 51, 3122–3136.
66. Wickert, J., Reigber, C., Beyerle, G., et al., 2001, Atmosphere sounding by GPS radio occultation: First results from CHAMP. Geophys.Res. Lett, 28, 3263–3266.
67. Wickert,J.,Beyerle,G.,Hajj,G.A.,Schwieger, V., Reigber,C.,2002, GPS radio Occultation with Champ:Atmospheric profiling utilizing the space based single difference technique. Geophys.Res. Lett, 29, doi: 10.1029/2001 GLO13982.
68. Wickert, J., T.Schmidt, G.Beyerle, R.Konig, C.Reigber, and N.Jakowski, 2004, The radio occultation experiment aboard CHAMP: Operational data analysis and validation of vertical atmospheric profiles. J. Meteorol. Soc, Japan, 82, 381 390.
69. Wilson, R., Hauchecorne, A., and Chanin, M. L., 1991,Gravity wave spectra in the middle atmosphere as observed by Rayleigh lidar. J. Geophys. Res, 96, 5153–5167.
70. World Meteorological Organization, 1957, Meteorology A three dimensional science. WMO Bull, 6, 134–138.
ACKNOWLEDGEMENTS
The first author (GNM) acknowledges to Advanced Centre for Atmospheric Sciences (ACAS), Sri Venkateswara University, sponsored by ISRO under RESPOND for providing Junior Research Fellowship, and lab facility to carry out this work. The authors thankful for the AIRS_AQUA, HIRDLS, AURA_MLS, SABER, GPS (CHAMP+COSMIC), ERA Interim, GEOS5, JRA 25, and MetO data centres for the public access via their website. Thanks to the authorities of S.V.University for providing the necessary facilities to carry out this work. Authors acknowledge the great help received from the scholars whose articles cited and included in the references of this manuscript. The authors are also greatful to the authors/editors/publishers of all those articles, journals and books from where the literature for this articles has been reviewed and discussed. Authors are grateful to IJCRR editorial board members and IJCRR team of reviewers who have helped to bring quality to this manuscript.

|
 IJCRR
IJCRR 


 This work is licensed under a Creative Commons Attribution-NonCommercial 4.0 International License


