IJCRR - 5(7), April, 2013
Pages: 47-57
Date of Publication: 18-Apr-2013
Print Article
Download XML Download PDF
NUTRITIONAL PROFILE OF SELECTED DESTITUTE WOMEN IN COIMBATORE DISTRICT
Author: Gomathi K., Yegammai C.
Category: Healthcare
Abstract:Background: India women's health and nutrition is inextricably linked to social, cultural and economic factors 2. The destitute women are more vulnerable to disease and deficiency disorder due to poverty, homelessness, stigmatization and exclusion from many aspects of normal life hence present study aims to assess the nutritional status of destitute women. Methods: Pre tested interview scheduled was administrated in person to the destitute women by the investigator and t test was used to interpreted the results. Results, Majority (30.4 per cent) of the women became destitute due to widowhood, and The diets of all the destitute women irrespective of the age group were found to be deficient in protein Conclusions, The main findings are were destitute women are suffering from many psychological problems. The nutritional status is below the average Indian women.
Keywords: Destitute women, Interview schedule, Anthropometric, Biochemical
Full Text:
INTRODUCTION A destitute woman is defined as a female suffering from lack of basic necessities for life, extremely poor and without adequate support from family or husband or other relatives 1 . In India the nutrition and health status of women is abysmally low. The National Nutrition Monitoring Bureau survey shows that women’s calorie requirement after the age of 10 years is not adequately met. The poor health status of women in India is mainly due to patriarchy and other socio-cultural constraints leading to poor health. It is a bitter reality that in India women’s health and nutrition is inextricably linked to social, cultural and economic factors 2 . The destitute women are more vulnerable to disease and deficiency disorder due to poverty, homelessness, stigmatization and exclusion from many aspects of normal life 3
Objectives:To
- Assess their nutritional status
- Estimate their biochemical profile
- Assess the nutritional knowledge among destitute women
METHODOLOGY
Sample
A destitute woman is defined who as a result of family tension or discord are made to leave their homes without any mean of subsistence and have no social protection from exploitation and are facing litigation on account of marital disputes (CSWB, 2005). Having this as the criteria, 500 destitute women were chosen. The destitute women were selected from the following homes of Coimbatore, Annai Illam, A Loving Home for Destitute Aged Women, Ondipudur, Aravanaikum Anbu Illam, Home for the Old Age, Thanneer Pandal, Mariyalaya Rehabilitation Home for Young Girls and Women in Distress, Anuparpalayam, Missionaries of Charity, Home for the Dying Destitutes, Ramanathapuram, Neyam Old Age Home, Vadavalli, Ram Aravinder Old Age Home, Vadavalli, St. Joseph Home for Aged Destitute, Podhanur, St. Thoms Old Age Home, Ramanathapuram, Thayakam Home for Women in Difficulties, Singanallore, The Coimbatore District Welfare Association, Senior Citizen Home, Matthipalayam and Tsunami Rehabilitation Centre, Koundampalayam.
Scales used
1. An interview schedule is the name usually applied to a set of questions which are asked and filled in a face to face situation with interviewer. The interview method is said to be the easiest and most reliable method of collecting data. Hence an interview schedule was designed to elicit information regarding socio-economic background, food habits, psychological and social problems.
Procedure
With the help of the Central Social Welfare Board (CSWB) the investigator identified and established rapport with the destitute women in the selected homes based on judgment sampling method. The willingness and consent was obtained from the subjects prior to the survey. Information regarding the socio-economic background, food habits, and psychological, behavioral and social problems were collected from the subjects by direct interview method. Three day weighment method was carried out in all homes and the individuals food intake was also noted and the food and nutrient intake of the individual were calculated. Anthropometric measurements like height, weight, waist and hip circumference were recorded and Body Mass Index (BMI) was calculated and Waist Hip Ratio (WHR) and skin fold thickness were measured. Since anaemia is a common problem among woman, the blood haemoglobin (g/dl) was analysed for all the 500 destitute women using cyanmethaemoglobin method. The prevalence of diabetes is increasing around the world at a rate that appears so dramatic as to have been characterized as an epidemic (Kelley, 2003). So the random blood glucose was analysed for ten pre cent (50) of sub sample by glucose oxidase method (NIN, 2003). Women appear to be at particular risk as the gender advantage for coronary heart disease is counter balanced by an increased incidence of obesity and diabetes (Pradhan et al., 2003). So serum total cholesterol was analysed for ten per cent of (50) subsamples by Zaks method (NIN, 2003). Biochemical parameter like hemoglobin and fasting and post prandial blood glucose levels was analyzed. Clinical assessment was done with a help of a registered medical practioneer a thorough examination of all the destitute women, for the presence or absence of clinical symptoms was noted using ICMR schedule.
RESULTS AND DISCUSSION
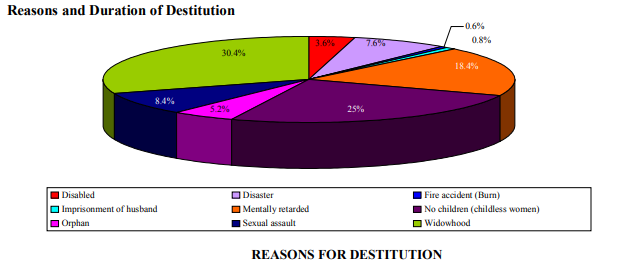
Of the selected destitute women, majority (30.4 per cent) of the women became destitute due to widowhood. Twenty five per cent of the selected women were destitute as they did not have children and they were sent out of their family. It is viewed from the figure that around 18.4 per cent of the destitute women were mentally retarded. Many of their parents and other family members did not want to take care of the mentally retarded patients, hence they were destituted. Majority (29.2 per cent) of the women live as destitute for more than 16 years. This might be due to the reason that they became destitute in their early part of their life (during childhood or adolescence). Goffman (1995) study is in line with the present study, which indicates that out of 161 destitute inmates, who were staying in the Mahila Mandirs of Kerala, 141 were elderly and 20 were adult women whose childhood had been spent in institution.
Type of menu followed by the homes
High percentage (62.8) of the destitute women reported that their menu was prepared depending on the availability of foods. This shows the low purchasing power of the destitute homes. About 25.8 per cent of selected destitute women mentioned that they had cyclic menu. Only 12.2 per cent of the destitute women said that they had variety in their menu. Most of the destitute homes did not provide adequate amount of fruits, green leafy vegetables, milk and milk products and other vegetables. The only source of fruit in the diet of these destitute women was Tomato. But among the eleven homed surveyed, only two homes rationed the food supply and all the other homes served the required amount of cereal preparations but limited amount of vegetable preparations (poriyal or kootu). Only the left over dhal or sambar of lunch was served with rasam during dinner in many of these homes.
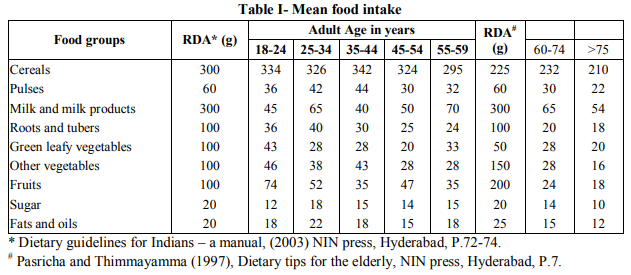
It is discouraging to note that the intake of cereal (8-11.3 per cent) was higher than the recommended allowances by adult women and this may result in over weight or obesity. According to American Dietetic Association (2000) older adults experience a decrease in appetite (Anorexia of ageing) and consume less food than younger adult. Similar results were obtained in the study among 100 elderly people by Thirumanidevi and Prapullakumari (2005) in which there was 12 per cent and 27.5 per cent deficit of cereals and pulses respectively. The higher cereal intake is due to the cereal based menu which is provided by the destitute home. NNMB report (1991) showed that the average intake of cereals and millets was 490g, pulses 32g, roots and tubers 40g, green leafy vegetables 11g, other vegetables 49g, milk and milk products 96ml, fats and oils 13g and sugar 29g by the Indian women. When compared with the average Indian women, these selected destitute women consumed lesser amounts. The deficit was highest (76.6-86.6 per cent) with regard to milk and milk products. Hemalatha et al., (2005) stated that expenditure on milk and milk products occupied the least priority among low income group women. Similar trend was also observed in the present study where higher deficit was noted due to inadequate supply in the destitute homes. When compared with the adult women, the elderly women (60 and above) had higher percentage of deficit in the consumption of fruits (88-91 per cent) followed by other vegetables (81.3-89.3 per cent), roots and tubers (80-82 per cent) and milk and milk products (78.3-82 per cent). Consumption of green leafy vegetables was also very less compared to recommended allowances. The deficit ranged from 57 to 80 per cent. The consumption of protective foods like all types of vegetables and fruits were very low due to lack of these foods in the diet of destitute women. A study conducted by Sivard (1995) lines with present study revealing that around 85 per cent deficit of green leafy vegetables in the diet of 366 institutionalized destitute women in Kerala. This slight lower deficit may be due to the fact that few destitute homes had kitchen gardens. The percentage deficit of roots and tubers was 60-75 per cent followed by other vegetables (54-72 per cent), fruits (26-65 per cent), protein (36.6-46.6 per cent), sugar (10-14 per cent) and fats and oils (10-25 per cent) in the diets of the 18-59 year old destitute women. Thus destitute women failed to maintain adequate diet.
When compared with 60 to 74 year group women, above 75 years had a greater deficit in all the food groups .This is due to the fact that with ageing process, several physiological and metabolic changes occur. Low appetite as a result of decreased physical activity and dental problems may also lead to overall reduction in the consumption of meat, fruits and all types of vegetables
Mean Nutrient Intake
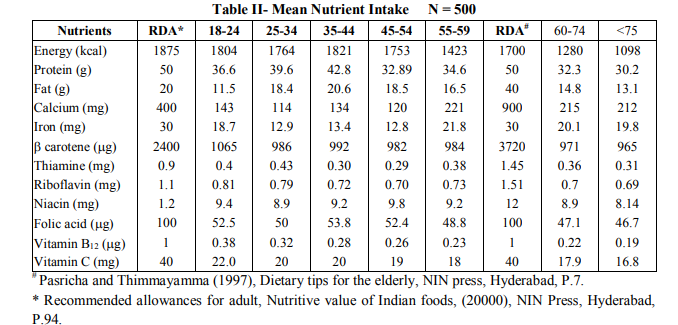
Intake of energy was found to be marginally less (2.8-6.4 per cent) than the recommended level in all the age groups except 24 per cent deficit in 55-59 year women. The energy intake of the elderly destitute women was lesser than the RDA. This finding is in accordance with Kauwell et al., (1999) who states that many oldest old (> 80 years) do not consume enough food at meals to meet their energy and nutrient requirements. As the age increases the energy intake decreases. (24.7 and 35.4 per cent by 60-74 and above 75 year aged women). The diets of all the destitute women irrespective of the age group were found to be deficient in protein .Higher (42.5) percentage of deficit of fat intake was observed in the diet of 18-24 year age women. All the other age group women showed a marginal deficit ranging from 3 to 17.5 per cent. According to Sharma (2000), the least adequately supplied nutrients in the diet of Indian elderly are calcium, Iron, vitamin A, and niacin along with energy. The percentage deficit of calcium was 64.5, 71.5, 66.4, 69.9 and 44.6 in the diets of 18- 24, 25-34, 35-44, 45-54, 55-59 year women respectively. Tobias (2004) also found that due to low intake of calcium throughout the life cycle of Indian women, the lumbar spine and femoral neck bone mineral density was lower than Caribbean women. Iron intake was also below the recommended allowances in all the age groups and the deficit ranged from 27.3-57.3 per cent. The other vital haemopoitic nutrient, folic acid was also lesser than the RDA and the deficit was 42.7, 50, 46.2, 47.6 and 51.2 per cent in the age group of 18-24, 25-34, 35-44, 45-54 and 55-59 year women respectively. Thus the cause of prevalence of anaemia is well established. Hoc (1999) suggested that women over 51 year of age and older should consume food fortified with folic acid and vitamin B12. He also reported that 10-30 per cent of older adult women have protein bound vitamin B12 mal absorption. Vitamin B12 intake among the destitute women in the present study was very less compared to normal women and the deficit ranged from 62 to 77 per cent. When compared with other vitamins, the intake of ? carotene was far below the ICMR allowances. This is due to the fact that only negligible amount of protective foods were provided by the destitute homes. It is very clear from the Table that the intake of all the nutrients was lesser than the RDA among elderly women also. Another fact is that as the age increases the deficit is also increases. This is due to the reason that their food intake is very much reduced. It is also found that maximum deficit was found with regard to the vitamin B12 (78 and 81 per cent) followed by calcium (76.1 and 76.4), Thiamine (75.1 and 78.6), ? carotene (73.8 and 74.0), vitamin (55.2 and 58), riboflavin (53.6 and 54.3), folic acid (52.9 and 53.3), iron (33 and 34) and niacin (25.8 and 32.1 per cent) by 60-74 and above 75 year aged women. Taste and smell dysfunction tends to begin around 60 year of age and becomes more severe in persons over 70. Hearing loss, impaired vision and loss of coordination are common in elderly. Income is often inadequate and elderly women may be forced to live under low socio economical status which also affects their food intake.
Anthropometric Measurements
Mean Height -Table III gives the details of mean height of the selected destitute women.
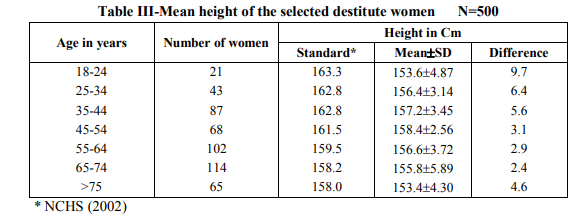
The height of the selected destitute women was lesser than that of NCHS Standard (2002). But the deficit was higher (9.7Cm) in the 18-24 year old women. A study by Haffman et al., (1985) revealed that there is eight cm difference in height when compared to the standard height among the Bangladesh women in the age of 18- 25. The difference was more compared to the normal women in the above study. This might be due to the fact that there was lack of adequate nutrition during growth spurt because of destitution.
Mean Weight - Table IV presents mean weight of the selected destitute women.
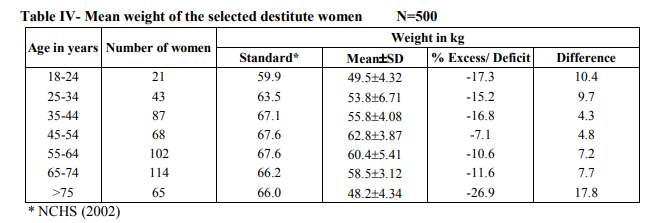
The mean weight of the destitute women was also lesser than the reference standard. But a higher (17.8 kg) difference was observed in the elderly when compared with all the other age groups. The deficit in weight ranged from 7 to 17.3 per cent. Siedell and Visher (2000) also reported similar observations in their study on the elderly, i.e., there was 14 kg difference than standard weight of the elderly, with increasing age and there was a declining trend in both heights and weights of the elderly. Because of destitution there may be a greater deficit in the present study than normal elderly women. Destitute women are more prone to weight loss due to depression. Depression can affect appetite dietary intake, digestion and weight status.
Body mass index( BMI)
Details of BMI the selected destitute women are presented in Table V.
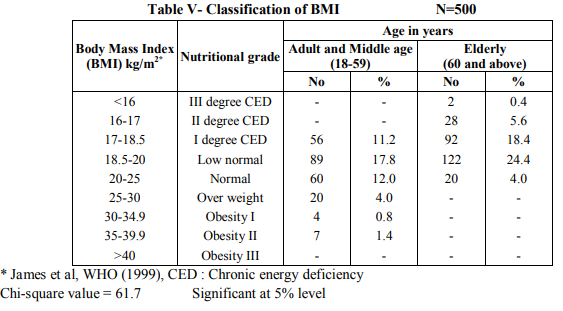
It is saddening to note that only 12 per cent of the adult and middle age and four per cent of the elderly destitute women have the normal BMI and 17.8 per cent of the adult and middle age women were in the grade of low normal. About 11.2 per cent of the destitute women were suffering from I degree chronic energy deficiency. Only a negligible per cent (0.8 and 1.4) were in the grade of obesity I and II. Among the elderly destitute women, majority 24.4 per cent were in the grade of low normal and 18.4 per cent were in the I degree chronic energy deficiency, 5.6 per cent and 0.4 per cent were in II degree and III degree chronic energy deficiency. When compared with middle age, the prevalence of chronic energy deficiency was more in the elderly destitute women. Wadhwa et al., (1997) also reported that elderly become vulnerable to malnutrition owing to inappropriate dietary intake, poor economic status and social deprivation. Statistically a 5 per cent significant relationship was observed in the BMI among the two age groups.
Waist Hip Ratio and skin fold thickness
Details of Waist Hip Ratio and Skin fold thickness of the selected destitute women are depicted in Table VI.
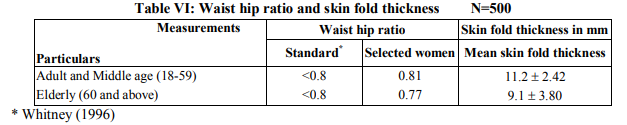
The Waist Hip Ratio was higher in adult and middle age destitute women compared to the standard value, because in this age group 2.2 per cent of them were found to be obese. But the elderly destitute women had lesser Waist Hip Ratio when compared with the reference value. De Groot et al., (1991) observed a consistently lower Waist Hip Ratio in elderly women than in men. The mean skin fold thickness was found to be very less (9.1mm) in elderly destitute women because, the fat depletion occurs with increasing age.
Biochemical Estimation
Table VII shows the mean haemoglobin, random blood sugar, serum total cholesterol levels of the selected destitute women
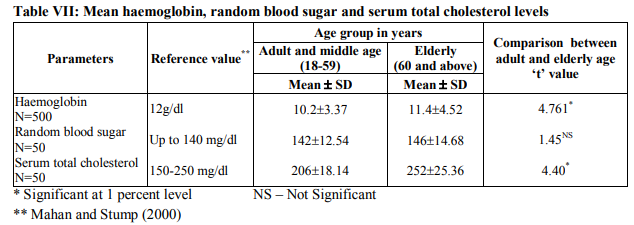
The mean blood haemoglobin level of the selected destitute women was found to be lower than the reference value. There is significant difference between the adult and elderly women. According to Mahan and Stump (2004) also the iron deficiency anaemia is uncommon in older adults than in younger people especially in women after menopause. NNMB report (1991) showed that 33.8 per cent of women in the age group of 25-44 years had anaemia in Madras. In the present study anaemia was prevalent among 37.7 per cent of adult destitute women. Thus it is clear that prevalence of anaemia is higher among destitute women which might be due to inadequate supply of protective foods in the destitute homes. Random blood sugar level was higher than the reference values for both adult and elderly destitute women. But there was no significant difference between the two age groups. Serum total cholesterol level of the elderly destitute women was beyond the normal range where as in adult and middle age women it was in the normal range. Thus a significant difference was observed between the elderly and adult women.
Clinical Examination
Details of clinical signs among the selected destitute women are presented in Figure 2.
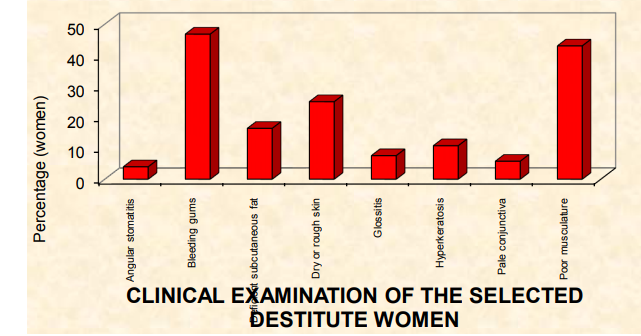
Majority 46.8 per cent of the selected destitute women had bleeding gums which is mainly due to vitamin C deficiency. This is due to the fact that most of these homes did not provide fruits. Poor musculature and deficient subcutaneous fat were common symptoms found among 43 and 16.4 per cent of the destitute women. Twenty five and 10.8 per cent of the selected destitute women had dry or rough skin and hyperkeratosis indicating a deficiency of vitamin A and essential fatty acid. Pale conjunctiva was found among 5.8 per cent of the destitute women. Around 7.6 and 4 per cent of the destitute women had glossitis and angular stomatitis ensuring the deficiency of B complex vitamins. All these symptoms are mainly due to the lack of adequate amount of protective foods. According to Raakhee and Raj (2003) the entry into the institution leads to feeling of neglected, lonely and emotionally deprived and all these may also result in inadequate food intake which leads to nutritional deficiency diseases among women.
Nutritional Knowledge D
etails of the Nutritional knowledge among the selected destitute women are shown in Table VIII.
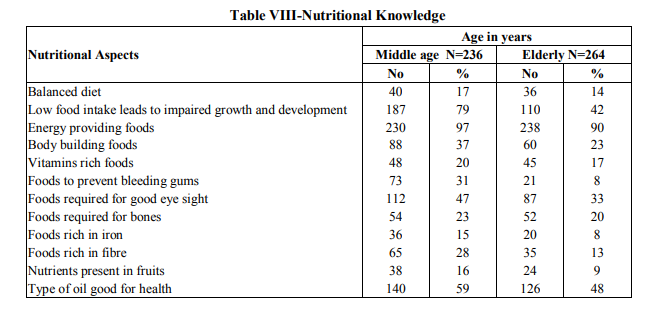
Majority (97 and 90 per cent) of the middle age and elderly destitute women had the knowledge about energy giving food followed by 79 and 42 per cent of the middle age and elderly destitute women felt that low food intake leads to impaired growth and development. Around 59 and 48 per cent of the middle age and elderly destitute women knew the type of oil needed for good health. When compared with middle age, the knowledge was lesser in the elderly in all nutritional aspects. This might be due to the fact that illiteracy of the elderly destitute women.
CONCLUSION
Destitute individuals feel neglected, lonely and emotionally deprived. The institutionalized destitute women are mostly forced to live under protection due to adverse circumstances trapped them in the cycle of disease and illness. The environmental and personal hygiene has a great influence on the destitute women’s health status. The poor accesses to health care centre to control infections and prevent diseases also lead to poor health status. Thus the above findings revealed that the nutritional status is below the average Indian women which might be due to two reasons: One the destitute homes provided adequate quantity of foods but it was not adequate in quality and the second reason was that these women did not consume adequate food due to their psychological problems. Hence efforts should be taken by the governmental and voluntary agencies to improve the nutritional status of the destitute women.
ACKNOWLEDGEMENT
Authors acknowledge the great help received from the scholars whose articles cited and included in references of this manuscript. The authors are also grateful to authors / editors / publishers of all those articles, journals and books from where the literature for this article has been reviewed and discussed. Authors are grateful to IJCRR editorial board members and IJCRR team of reviewers who have helped to bring quality to this manuscript.
References:
1. Apte, J.K., Coping strategies of destitute women in Bangladesh, Bangladesh Rural Advancement Committee, Dhaka1997, Pp.110-142.
2. Patel,P., Capoor,I and Joshi,U., Research report on knowledge, awareness,belief and practice on reproductive health in slums of Ahmedabad,2000, P.2.
3. Karkal and Malini. (2000), Dynamics of population and family welfare, Himalaya Publishing House, Bombay, Pp.21-32.
4. Goffman,E., Institutional Neuroses, Psychological Studies, 1995,32(4) Pp.48-50.
5. Padmam,M.S.R., Destitute women in Kerala - psychological resources and psycho-social needs, Behavioural Sciences,2001, 54(4), Pp.5-41.
6. Raamanujam,K.N and Thenmozhi,R (2006), Empowerment of Women, Kisan World, 33(1), P.62.
7. Hemalatha,G., Subapriya,M.S and Chandrasekar,U.,Food expenditure of families belonging to low income group (LIG) and different activity categories, Research Highlights, 2005,15(2), Pp.69-74.
8. Srivard,R., Women - A world survey, World Priorities, Washington, 1995,Pp.109-14.
9. Thirumanidevi,A and Prapullakumari,B. , Nutritional profile and problems of selected elderly living with their family, Research Highlights, 15(3), PP.125-132.
10. American Dietetic Association. , Nutrition ageing and contirum of case, Journal of American Dietetics Association, 2000, 100(2) Pp.580-595.
11. Hoc,L. Practitioner guide to meet the Vitamin B12,Recommonded dietary allowances for people aged 51 years and older, Journal of American Dietetics Association, 1999, 99(.2) Pp.725-727
12. Tobias., A comparison of bone mineral density between Asian and Afro-caribbean women, Clinical Science, 2004 97(5) Pp.587- 91.
13. Kauwell,L., Foote,J,A and Harries R,B. Older adults need guidance to meet nutritional recommendations, Journal of American college of Nutrition, 1999 19, (5), Pp.628- 640.
14. Sharma,S. Dietitian urged to develop dietary guidelines for the elderly, Journal of Nutrition, 2000,30(2) Pp.11,13.
15. Seidell,J.C and Visscher,T.L.S., Body weight and weight change and their health implications for the elderly, European Journal of Clinical Nutrition, 2000, 54(3), Pp.33-39.
16. Huffman,S.L., Wolff,M and Lowell,S., Nutrition and fertility in Bangladesh, Nutritional status of non-pregnant women, American Journal of Clinical Nutrition, 1985,59(2) Pp.725-738.
17. National Centre for Health Statistics. (2002), Third National Health and Nutrition Examination Survey, Center for Disease Control and Prevention, P.39.
18. Wadhwa,A., Sabharwal,N and Sharma,S., Nutritional status of the elderly, Indian Journal of Medical Research, 1997,106, Pp.340-348.
19. De Groot., Sette S. and Zaikar G., Nutritional status and anthropometry, European Journal of Clinical Nutrition, 199145(3), p.31-42.
20. Mahan, L.K and StumpS.E., Krause’s Food, Nutrition and Diet Therapy, 11th Edition, Saunders Publishers, USA, 2004, Pp. 327,344, 1001.
21. Raakhee, A.S and Raj,H.S.S., Alienation of among the institutionalized and noninstitutionalized women, Psychological Studies, 2003,48(2), Pp.65-68.
|
 IJCRR
IJCRR 


 This work is licensed under a Creative Commons Attribution-NonCommercial 4.0 International License


