IJCRR - 5(12), June, 2013
Pages: 12-20
Date of Publication: 28-Jun-2013
Print Article
Download XML Download PDF
STUDIES ON THE OCCURRENCE OF DUCT AND SUPERREFRACTION OVER INDIAN REGION
Author: N. Radha Krishna Murthy , S. Vijaya Bhaskara Rao
Category: General Sciences
Abstract:Cosmic GPS data for the years 2007 and 2008 is taken to analyze the occurrence of ducts and super refraction over Indian region corresponding to latitudes -5o to 40o and longitudes from 60o to 100o up to a height of 5Km from sea level. Number of duct regions, high duct strength regions and superrefraction regions are counted over Arabian Sea, Bay of Bengal and land regions. Arabian sea region has more number of duct regions during postmonsoon (September, October, and November), premonsoon (March, April, May) and winter (December, January, February) seasons and less number during summer monsoon (June, July, August,) season. More number of duct regions observed over Bay of Bengal during winter than other seasons. Land region has more number of duct regions during post monsoon season. More number of superrefraction regions occurs over Arabian Sea in pre monsoon season; over Bay of Bengal during winter and Pre monsoon seasons and over land region during post monsoon season. Majority of duct regions are found to occur at heights less than 1.5 Km and majority of superrefraction regions at heights less than 2 Km from sea level.
Full Text:
INTRODUCTION
The use of GPS satellite signals by means of radio occultation has shown a great potential for the determination of upper troposphere and stratosphere refractivity profiles. Temperature and pressure profiles can be calculated from these refractivity profiles using the hydrostatic equation and ideal gas law [Kursinski et al., 1997]. The Constellation Observing System for Meteorology, Ionosphere, and Climate (COSMIC) will provide high vertical resolution temperature, pressure and water vapor information for a variety of atmospheric process studies and improve the forecast accuracy of numerical weather prediction models. The cosmic data set will allow investigation of the global water vapor distribution and map the atmospheric flow of water vapor that is so critical for understanding and predicting weather and climate. Ducting is caused by a strong gradient in refractivity N with respect to altitude. Refractivity itself is calculated following the formula given by Smith and Weintraub [1953], Valid at GPS frequencies:

pi is atmospheric pressure at level i (with radius ri) in [hPa], Ti is atmospheric temperature at level i in [K], and ei the water vapor partial pressure at level i in [hPa]. The refractivity gradient dN/dh with respect to altitude h is used to characterize the atmospheric conditions. A region with ( dN/dh ) ≥ - 39 Km-1 is called subrefractive. These conditions lead to radio waves being refracted away from the earth’s surface. Regions with ( dN/dh ) < -39 Km-1 and > -79 Km-1 show normal refraction. Regions with dN/dh ≤-79 Km-1 and >-157 Km-1 are called superrefractive [Almond and Clarke, 1973]. Critical refraction occurs when the radius of curvature of the ray is equal to the radius of curvature of atmosphere and the ray will propagate at a fixed height above the surface. Ducts appear when dN/dh leads to rays that curve down into the surface at low altitudes, which is given when: dN/dh ≤ -10-6 / Rc (2) where Rc is radius of curvature of atmosphere in [Km]. This condition is fulfilled when dN/dh ≤-157Km-1 for a mean value of Rc [Kursinski et al.,1997]. dN/dh = N’ = 77.6 (p’/T) -77.6 T’(P/T 2 ) + 3.73X 10⁵ ( e’ /T2 ) - 3.73X 10⁵ T’( e /T3 ) (3) The first term represents the hydrostatic variation of pressure with altitude, it is about - 30 Km-1 . The second term will be more important closer to the surface where higher pressures are found. The third term will generally contribute to ducting at altitudes where strong gradients in e are found. The fourth term is negligible. The nature of the duct is determined by the meteorological conditions that alter temperature and water vapor content in the region. Ducts occur over the earth`s surface as a result of advection, evaporation over the sea, anticyclonic subsidence, subsidence at the frontal surfaces, nocturnal radiative cooling over land, and convective activity during the day ( Turton et al 1988, craig 1996). The surface features from which the weather systems move are crucial in determining the duct characteristics (Gossard 1977). Evaporation and boundary layer ducts are two subgroups of the surface ducts. In addition, more localized effects such as sea breezes, thunder storms, or microburst out flows can cause ducting over land (Turton et al 1988). Ducting has been observed in radiosonde data at altitudes up to around 4km but most ducting events are found below 2 km [Patterson, 1982; Kursinski et al., 1997]. The maximum altitude for ducting was estimated by Kursinski et al. to be around 5Km. . Babin (1996) investigated the height and frequency distributions of surface ducts statistically over Wallops Island, Virginia, by using high-resolution helicopter measurements. He found that the largest surface ducts were observed mostly from April to June and from July to September over Wallops Island. Brooks et al. (1999) studied the surface evaporation and boundary layer duct characteristics over the Persian Gulf. A more recent study on refractive conditions by Bech et al. (1998, 2000, 2002) was done in Barcelona, Spain, to determine the anomalous propagations at their radar site. A comprehensive examination of 2 yr of radiosonde data to determine the surface duct conditions over Istanbul (4°N, 29°E), Turkey, was made by S¸. Sibel Mentes and Zerefsan Kaymaz [2007] . It was found that most of the ducts occur in May and July. The highest occurrence rate of surface ducts was observed in the summer season, and the lowest rate was observed in the winter season. The median duct thickness and duct strength are found to be the highest and the strongest in summer, whereas they are the lowest and the weakest in winter. An interesting study on the effect of ducting has recently been performed based on the European Centre for Medium-Range Weather Forecasts (ECMWF) analysis for a 10 day period in May 2001 [von Engeln et al., 2003] . On the basis of the locations of the simulated occultations in this period, the study examined how often an occultation is affected by ducting as well as the height and thickness distributions of the ducts. It was reported that only 10% of the simulated occultation profiles showed ducts and that no ducts were found above 2.5 km altitude. This study was subsequently expanded with the construction of a ducting climatology using six years of ECMWF analysis data [von Engeln and Teixeira, 2004] , providing extremely valuable information on ducting statistics across the globe.
A comprehensive study on the ducting conditions prevailing over the Indian tropical station of Gadanki (13.5_N, 79.2_E) is made using high-resolution GPS radiosonde observations [ Ghouse Basha et al.,2013 ] . In this study, strong diurnal and seasonal variation in the percentage occurrence of the ducts was found with the highest and lowest occurrences during winter and monsoon seasons, respectively.
DATA AND METHODOLOGY
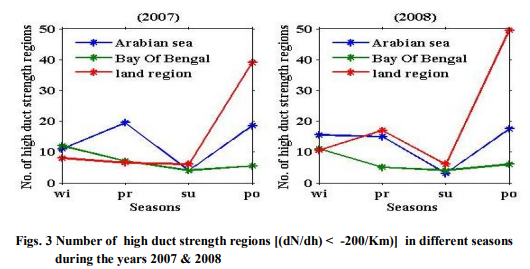
Cosmic GPS data of years 2007 and 2008 is taken to study occurrences of duct and Superrefraction regions in the region -5 o S to 40oN and 60oE to 100oE. This region is divided into 423 grids each of size 2.0455o x 2 o . Refractivity values over the region from sea level to a height of 5Km are extracted from cosmic data and its seasonal average is calculated for winter, pre monsoon season, summer monsoon and post monsoon seasons. Gradient of refractivity is calculated for every height of 100m from sea level to a height of 5Km and number of duct regions, high duct strength regions [(dN/dh) ≤ 200/Km)] , superrefraction regions are counted over Arabian Sea, Bay of Bengal and Land region during four seasons. Profiles showing variation of number duct regions, High duct strength regions, and super refraction regions over Arabian Sea, Bay of Bengal, and Land region in different seasons during the years 2007 & 2008 at different heights are plotted.
RESULTS AND DISCUSSIONS
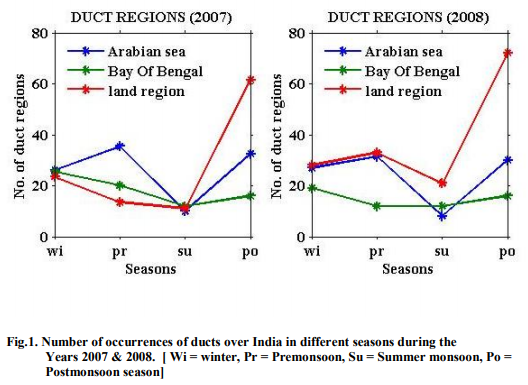
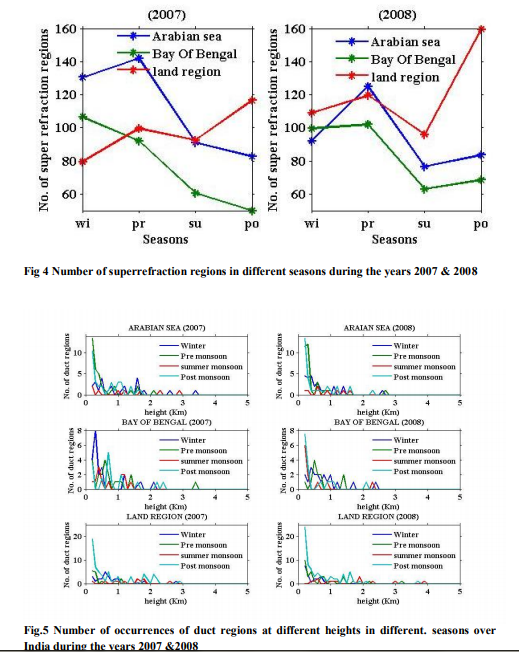
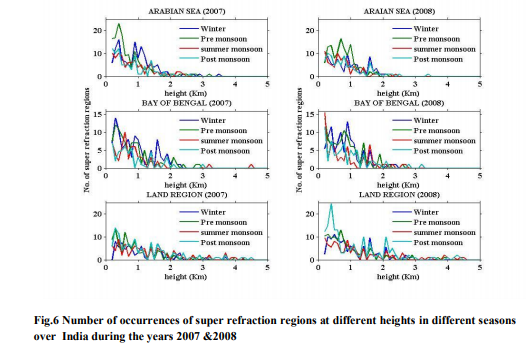
Fig 1 represents number of ducts occurred over Indian region during the years 2007& 2008. Arabian sea has more number of ducting regions during pre monsoon , post monsoon, and winter seasons and less number of ducting regions during summer monsoon season. Over Indian land region, large number of ducts occurred during post monsoon season than other seasons. Over Bay of Bengal region more number of ducts occurred during winter season. Fig. 2 represents number of ducts over India at heights ≤ 0.5Km & > 0.5 Km during the years 2007 & 2008. Over Arabian sea, number of duct regions having height less than or equal to 0.5 Km occurred is more during 2007 pre monsoon, post monsoon seasons and less during summer monsoon season. Duct regions having height greater than 0.5 Km occurred more in number during 2007 winter and post monsoon seasons and less in number during summer monsoon season. 2008 year data shows similar variation. Over Bay of Bengal , ducts having heights less than or equal to 0.5 Km occurred more in number during 2007 winter season and less in number during post monsoon and summer monsoon seasons. 2008 year data shows that more number of these ducts occur during post monsoon season and less number of ducts occurred during pre monsoon season. More number of ducts having height greater than 0.5 Km occurred during 2007 pre monsoon and post monsoon seasons and less number of these ducts during summer monsoon season. 2008 year data shows that more number of these ducts occurred during winter season and less number during summer monsoon season. Over land region, number of ducts having height less than 0.5 Km occurred is more during post monsoon season and less during summer monsoon. Similarly 2007 data shows that ducts having height greater than 0.5 Km occurred more in number during post monsoon season and less in number during pre monsoon season. 2008 year data shows that number of these ducts occurred is more during post monsoon season than other seasons. Number of duct regions having gradient less than or equal to -200/ Km over Arabian sea, Bay of Bengal and land region of India during different seasons of the years 2007 & 2008 are represented in figs3. 2007 year data shows that Duct regions having gradient of refractivity less than -200 /Km (high duct strength regions) occurred more in number over Arabian sea during post monsoon and pre monsoon seasons and less in number during summer monsoon season. 2008 year data shows that more number of these duct regions occurred during post monsoon and winter monsoon and pre monsoon seasons and less in number during summer monsoon season. Over Bay of Bengal, number of these high duct strength regions occurred is more during winter season than other seasons. Over land region, number of high duct strength regions occurred is high during post monsoon season than other seasons. Over Arabian sea, [von Engeln, A., 2004 ] number of duct regions is high during pre monsoon, post monsoon and winter seasons. A combination of warm water temperatures during these seasons with dry air from the deserts aloft leads to higher ducting probability [Brooks et al., 1999]. During summer monsoon season, the water temperature decreases. This cooling in summer is produced by the south-west monsoon, which causes southwest winds that generate an upwelling of cold water [Tomczak and Godfrey, 2003]. Increased winds will lead to more mixing, thus reducing the ducting probability. Hence small area over Arabian sea is covered with duct regions during summer monsoon season. Over Bay of Bengal, number of occurrence of duct regions increases during winter monsoon season [Jaswal, A. K., et al.,2012] due to increased difference between sea surface temperature and surface air temperature and clear sky conditions. Over land region, high number of duct regions is occurred during post monsoon season than other seasons. This is due to flow of dry polar north east winds, nocturnal radiative cooling, dew deposition, fog development and clear sky conditions over land regions. Arabian sea, Bay of Bengal region and land region show different ducting behavior due to different local and synoptic weather conditions. Fig. 4 show number of superrefraction regions in different seasons during the years 2007 &2008. During the year 2007, over Arabian sea, more number of superrefraction regions occur in premonsoon season and less number in post monsoon season. 2008 data shows that more number of these regions occur over Arabian sea during premonsoon season and less number in summer monsoon season. Over Bay of Bengal, more number of super refraction regions occur in winter monsoon season and less number in post monsoon season during the year 2007. 2008 year data shows that more number of super refraction regions occur in winter and premonsoon seasons and less number in summer monsoon season. Over land region, more number of super refraction regions occur in post monsoon season than other seasons. Fig.5 shows number of duct regions at different heights over Arabian sea, Bay of Bengal and Land region. Fig.6 shows number of super refraction regions at different heights over Arabian sea, Bay of Bengal and Land regions. . Majority of duct regions are found to occur at heights less than 1.5 Km and majority of superrefraction regions at heights less than 2 Km from sea level.
CONCLUSIONS
Cosmic GPS data of years is 2007 & 2008 is taken to analyze the occurrence of duct regions over India region. Profiles of number of duct regions, high duct strength regions and superrefraction regions from sea level to a height of 5Km are plotted during different monsoon seasons. Except during summer monsoon season, Arabian sea region has high number of duct regions in all seasons. Bay of Bengal region has more number of duct regions during winter season than other seasons. High number of duct regions occurred over land region during post monsoon season than other seasons. More number of high duct strength regions occur over Arabian sea during post monsoon, pre monsoon and winter seasons and less number during summer monsoon season. Bay of Bengal has more number of high duct strength regions during winter monsoon season than other seasons. More number of high duct strength regions occurred over land region during post monsoon season than other seasons. More number of superrefraction regions occur over Arabian sea in pre monsoon season, over Bay of Bengal during winter and Premonsoon seasons, and over land region during post monsoon season.
ACKNOWLEDGEMENTS
We are grateful to M. Venkat Ratnam, National Atmospheric Research Laboratory (NARL), Gadanki, for providing necessary data for the present study. We are also thankful to UGC - SVU CENTRE FOR MST RADAR APPLICATIONS S.V.UNIVERSITY, TIRUPATI , for providing facilities to carry out this work. Authors acknowledge the great help received from the scholars whose articles cited and included in references of this manuscript. The authors are also grateful to authors / editors / publishers of all those articles, journals and books from where the literature for this article has been reviewed and discussed. Authors are grateful to IJCRR editorial board members and IJCRR team of reviewers who have helped to bring quality to this manuscript.


References:
1. Almond, T., and Clarke, J., 1973, Considerations of the usefulness of the microwave prediction methods on air-toground paths, IEEE Proc., Part F, 130, 649–656.
2. Brooks, I., A. Goroch, and D. Rogers, Observations of strong surface radar ducts over the Persian Gulf, J. Appl. Meteor., 38, 1293–1310, 1999.
3. Babin, S. M., 1996: Surface duct height distributions for Wallops Island,Virginia, 1985–1994. J. Appl. Meteor., 35, 86–93.
4. Brooks, I. M., A. K. Goroch, and D. P. Rogers, 1999: Observations of strong radar ducts over the Persian Gulf. J. Appl.Meteor., 38, 1293–1310.
5. Bech, J., D. H. Bebbington, B. Codiba, A. Sairouini, and J.Lorente, 1998: Evaluation of atmospheric anomalous propagation conditions: An application for weather radars. Remote Sensing for Agriculture, Ecosystems, and Hydrology. E. T.Engman, Ed., International Society for Optical Engineering (SPIE Proceedings Vol. 3499), 111–113.
6. Bech, J., A. Sairouni, B. Codina, J. Lorente, and D. Bebbington,2000: Weather radar anaprop conditions at a Mediterranean coastal site. Phys. Chem. Earth, 25B (10–12), 829–832.
7. Bech, J., B. Codina, J. Lorente, and D. Bebbington, 2002: Monthly and daily variations of radar anomalous propagation conditions: How “normal” is normal propagation? Proc. Second European Conf. of Radar Meteorology, Delft, Netherlands,ERAD Publication Series, Vol. 1, Copernicus GmbH, 35–39.
8. Craig, K. H., 1996: Clear air characteristics of the troposphere.Propagation of Radio Waves, M. P. Hall, L. W. Barclay, and M. T. Hewitt, Eds., The Institution of Electrical Engineers,105–130.
9. Craig, KH., and T. G. Hayton, 1995: Climatic mapping of refractivity parameters from radiosonde data. Proc. Conf. 567 on Propagation Assessment in Coastal Environments, Bremerhaven, Germany, AGARD-NATO, 43-1–43-14.
10. Gossard, E. E., 1977: Refractive index variance and its height distribution in different air masses. Radio Sci., 12, 89– 105.
11. Ghouse Basha, M. Venkat Ratnam, G. Manjula, and A. V. Chandra Sekhar, 2013, Anomalous propagation conditions observed over a tropical station using high-resolution GPS radiosonde observations, RADIO SCIENCE, VOL. 48, 1–8, doi:10.1002/rds.20012.
12. Jaswal. A. K. et al., 2012, Relationship between sea surface temperature and surface air temperature over Arabian Sea, Bay of Bengal and Indian Ocean, J. Ind. Geophys. Union Vol.16, No.2, pp. 41-53, April 2012.
13. Klein, S., and D. Hartmann, 1993, The seasonal cycle of low stratiform clouds, J. Climate, 6, 1587–1606.
14. Kursinski, E., G. Hajj, J. Schofield, R. Linfield, and K. Hardy, 1997, Observing Earth’s atmosphere with radio occultation measurements using GPS, J. Geophys. Res., 102, 23,429–23,465.
15. Patterson, W., 1982, Climatology of marine atmospheric refractive effects:a compendium of the Integrated Refractive Effects Prediction System (IREPS) historical summaries, NOSC Tech. Doc.573, Naval Ocean Systems Center, San Diego, CA, USA,522 pp.
16. S¸. Sibel Mentes and Zerefsan Kaymaz , 2007, Investigation of Surface Duct Conditions over Istanbul, Turkey, Journal of Applied Meteorology and climatology,46,318-337, DOI: 10.1175/JAM2452.1
17. Smith, E., and S. Weintraub, 1953, The constants in the equation for atmospheric refractive index at radio frequencies, Proceedings of the I.R.E., 41, 1035–1037.
18. Tomczak, M., and J. Godfrey, 2003. Regional Oceanography: an Introduction, 2nd ed., Daya Publishing House, Delhi, 390 pp.
19. Turton, J. D., D. A. Bennets, and S. F. G. Farmer, 1988: An introduction to radio ducting, Meteor. Mag., 117, 245–254.
20. von Engeln, A., and J. Teixeira (2004), A ducting climatology derived from the European Centre for Medium-Range Weather Forecasts global analysis fields, J. Geophys.
21. Res.,109, D18104, doi:10.1029/2003JD004380.von Engeln, A., G. Nedoluha, and J. Teixeira (2003), An analysis of the frequency and distribution of ducting events in simulated radio occultation measurements based on ECMWF fields, J. Geophys. Res., 108(D21), 4669, doi:10.1029/ 2002JD003170.
|


 This work is licensed under a Creative Commons Attribution-NonCommercial 4.0 International License