IJCRR - 5(14), July, 2013
Pages: 115-120
Date of Publication: 29-Jul-2013
Print Article
Download XML Download PDF
PERFORMANCE FORECAST OF PHOTOVOLTAIC ENERGY SOURCE SYSTEM MODEL
Author: E. Jensi Miriam, S. Ambalavanan
Category: Technology
Abstract:Photovoltaic energy source model is designed in this work and its performance is evaluated. For this study of daily measurements of the global solar radiation over a period has been attempted .The equation for the estimation of global solar radiation is designed and validated. The validation of this model is compared with experimental results obtained at local solar station. This simulation comparison is based on sampled local climatic data of sunny and sunless day. On a day, Panel generates power from dusk to dawn and its various level of radiation during every hour is noted at the normal temperature and battery available capacity is also noted. Obtained results show that both models simulation are quite satisfactory. These results should help system engineers to choose the right control strategies and the battery industry to choose and develop appropriate batteries for PV applications.
Keywords: solar radiation model, PV energy source, Performance forecast of PV system, panel power output, PV module.
Full Text:
INTRODUCTION
In this study a statistical analysis of total solar radiation were made .Total daily solar radiation is considered as the most important parameter in the performance of renewable energy systems, particularly in sizing PV power and solar systems. The presence of clouds and rains would reduce the amount of irradiation delivered to a particular site due to scattering and absorption [1]. Insolation (INcoming SOLar radiATION) is a measure of the solar energy striking a unit surface area in a unit time. It determines how much electrical power a photovoltaic solar panel will deliver – the more sunlight you have, the more power you get [2]. The stand alone solar photovoltaic street lighting system comprises of a compact fluorescent lamp (CFL lamp) as light source, rechargeable lead acid battery for storage, PV modules for charging a battery .Deep cycle batteries should always be used for stand-alone PV system. A photovoltaic module is the basic element of each photovoltaic system. It consists of many jointly connected solar cells .Solar cells are a renewable, non-polluting source of energy that are increasingly used for hybrid (solar panels and grid) or stand-alone applications. This program allows the users to determine at any moment the performance of the PV installation by comparing the PV electric energy produced and the required consumption load conversion from solar to photovoltaic electric energy is one of the mostly direct usages of solar energy [3]. Computer simulation techniques can be used to test the performance of various components of the PV system. Photovoltaic conversion is the direct transformation of solar energy into immediately usable direct electric current. The current and power outputs of photovoltaic modules are approximately proportional to sunlight intensity. At a given intensity, a module’s output current and operating voltage is determined by the characteristics of the load. So it is very much necessary to operate the PV at its maximum power point. The PV module shortcircuit current is directly proportional to the insolation. A module with a rating of 17 volts will put out less than its rated power when used in a battery system. Most panels are rated in watts of power that can theoretically be produced on a high intensity day. A 40 watt panel with a 12V output will therefore be capable of generating 40W / 12V = 3.3 amperes peak current. In reality, these peak currents are normally not achieved, and true outputs are about 80 to 90% of the ratings. To maintain continuous operation of a load, it is therefore necessary to have a reserve battery that can be discharged and recharged upon demand. To prevent an overcharge condition on the lead acid battery, it is necessary to use a solar regulator board between the panel and the battery [4-5].
METHODOLOGY
Larger panels produce more power than smaller panels. Bright sunshine produces more power than cloud cover. Time of year may also affect output: solar intensity is reduced in winter. Finally, snow or other materials covering the panel may reduce or cut off power output. Time of year also affects the duration of light available to the panel. In middle latitudes, summer days may have 14 hours of daylight, while winter days may have as few as ten hours. In higher latitudes, daylight hours may be even further reduced. Estimating the average solar radiation over a period, Gives how much power the solar panel will generate. Assume that the sun averages at different level of radiations over a period of 8 hours per day .The current generated by the solar panel is proportional to the ratio of the actual solar radiation to 1000 W/m2 multiplied by Isc. Therefore, the average current would be, I avg = (G /1000) W/m² * I sc and G = Level of radiation (100 to 1000 W/m²).
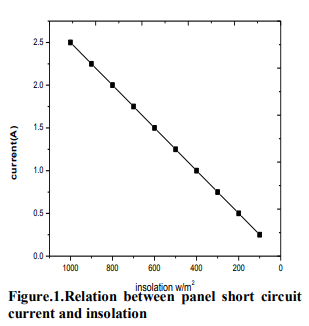
Amp – Hours is equal to the average current multiplied by the number of hours at this current. Panel power output is calculated by the panel voltage multiplied by Ampere hour .It has been noted From figure (1) that the short circuit current (ISC) of the solar cell decreases when irradiance is less than 1000 Wm2 irrespective of the working temperature of the cell. In the proposed system, the irradiance level is considered to vary, solar radiation level G changes from 100 to 1000 W/m². From figure (2) it is seen that standard program is created for calculating panel power for different solar panel .Thus different database table is created using solar radiation model programmed in Visual basic 6.0 for corresponding solar panel used for different applications. Therefore table 1 shows the behavior of battery ON-TIME charging with corresponding panel power output at different hours of a day for 40W panel. Solar radiation data which is collected in our station is in terms of lux. The lux is the unit of luminance in the International System of Units. It is defined in terms of lumens per meter squared (lm/m2 ) .An alternative unit is the watt per meter squared (W / m 2 ).
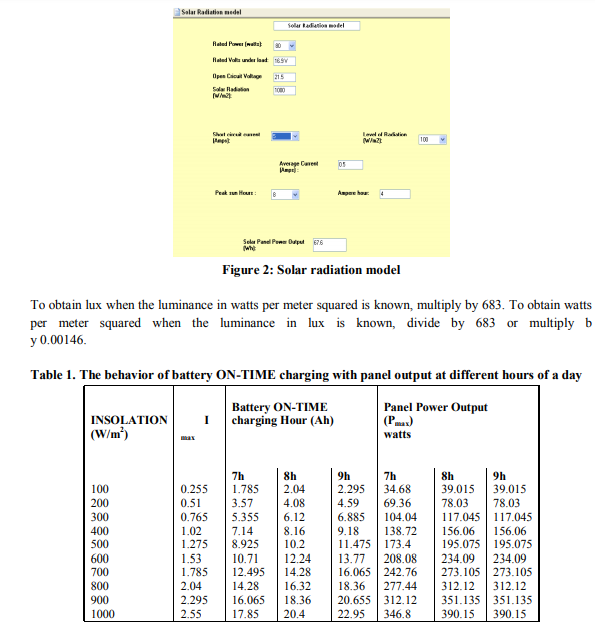
This solar radiation model future compares the panel power output of field data. Thus the calculating cum simulation is made for different rated panels. Table 2 shows maximum panel output power for different rated panels. Using this proposed model, we can create a database of the panel power output for various rated panels. This type of data analysis is more suitable in making initial determination of panel power output of the particular rated panel.
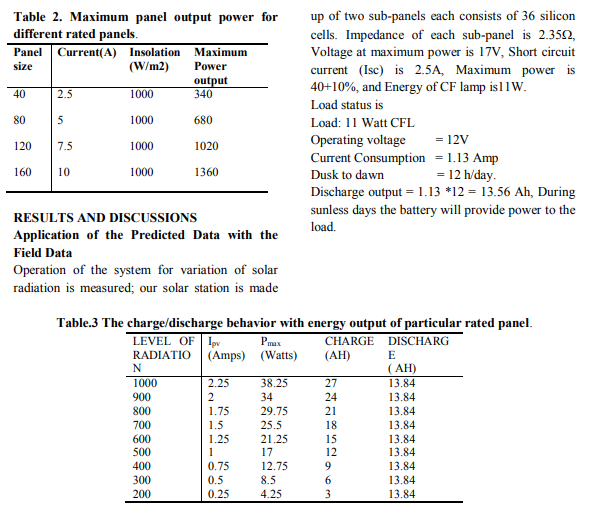
To calculate the power generated by the total solar radiation falling on a panel during insolation per day and the results of panel power output of PV stand alone lighting model for various sunny and sunless days are made using this new proposed model. Panel current generated at any time are simulated and the behavior of a PV module at different level of radiance is designed using this proposed model. This physical modeling technique does not require the knowledge of internal system parameters, involve less computational effort and offer a compact solution for multivariable problems.
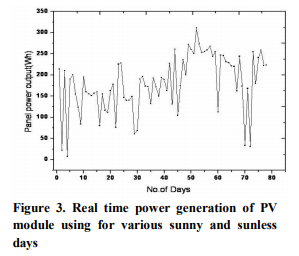
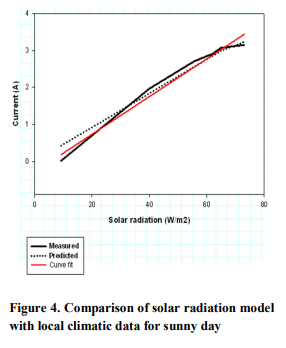
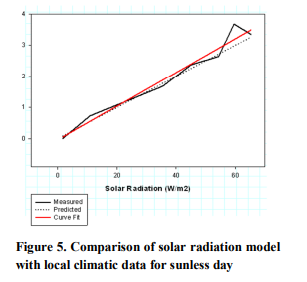
During analyzing, curve fitting technique is implemented to get smooth relationship between these data’s. Different month’s lux value is calculated and smoothed. Figure 3.shows typical data on clear (sunny) days maximum lux is 90,000/mm2 and Typical data on cloudy (sun less) day maximum lux is 30,000/mm2 .Error estimation method is carried out using sigma plot so as to get relationship between measured and predicted data. These data are compared with the simulated proposed model and shown in figures 4 and 5 respectively. From the result it is seen that our model predicts to a larger extent the output of solar panel within experimental limitations.
CONCLUSION
This study tries to develop one simple, practical, yet more accurate radiation model for describing the characteristics of the power output of PV modules. Estimated radiation models to compute solar radiation has been compared with the corresponding measured values. Simulated results from the model under the same operating and environmental conditions are compared with those observed from the experimental tests. Good agreement is found in the comparison. Slight discrepancies appearing in the results are described and recommendations are given for further improvement. This type of simulation can save a large amount of time and money. We can often explore a large number of scenarios very quickly. The result will help system engineers to choose the right control strategies for panel and batteries.
ACKNOWLEDGEMENTS
The Authors are thankful to the Ministry of New and Renewable Energy, Government of India and council of scientific and industrial research for the support to carry out this work.
References:
1. Hamrouni Jr N, Aidi M, Cherif A. New control strategy for 2-stage grid connected photovoltaic power system. Renewable Energy 2008;33(08):2212-21
2. Barambones, O., Etxebarria, V., 2002. Energy-based approach to sliding composite adaptive control for rigid robots with finite error convergence time. International Journal of Control 75 (5), 352–359.
3. Chang, E.C., Liang, T.J., Chen, J.-F., Chang, F.-J., 2008. Real-time implementation of grey fuzzy terminal sliding mode control for PWM DC–AC converters. IET Power Electronics 1 (2), 235–244.
4. Trishan Esram, and Patrick L. Chapman, “Comparison of Photovoltaic Array Maximum Power Point Tracking Techniques”, IEEE Trans. On Energy Conversion, vol.22, pp.439–449, June 2007.
5. Yamashita H, Tamahashi K, Michihira M, Tsuyoshi A, Amako K, Park M. A novel simulation technique of the PV generation system using real weather conditions. In: Proceedings of the power conversion conference, PCC, Osaka, 2002, vol. 2. p. 839–44.
|


 This work is licensed under a Creative Commons Attribution-NonCommercial 4.0 International License