IJCRR - Vol 09 issue 10 current issue , May, 2017
Pages: 01-06
Date of Publication: 27-May-2017
Print Article
Download XML Download PDF
Land Use/Cover Mapping of Konkan Region, Maharashtra
Author: Arjun B. Doke
Category: General Sciences
Abstract:The land is used for different activity, such as agriculture, forests, mining, transport, settlement, entertaining and manufacturing. The unused lands are unproductive waste and i.e. barren and fallow (temporary and permanent) land. Green canopy plays an important role in maintain surface temperature and humidity. The present study land use and land cover was identified through exploratory analysis, done on the bases of multitemporal Landsat TM data. The final classification map provided the land use and land cover information. The ground truthing was used to assess the accuracy of the land use and land cover analysis. Three specific bands were used with reasonable success to correlate soil, wetness and vegetation. The present study the cropland covers the highest area 10814 square kilometer in percent 35.17. Dense forest cover second large area 5653 square kilometer in percent 18.39. The settlement covers the lowest area, which is 678 square kilometer in percent 2.18. Combinations of supervised and unsupervised classifications were conducted to define land cover and land use types for the study area. The resulting products of the exploratory analyses and classification were then used to assess spatial patterns of land cover and land use in the study area.
Keywords: Land use, Land cover, Remote sensing, Image classification, Konkan Region
Full Text:
Introduction:
The land is necessary for human survival because it’s available for
a human with living space (Bhagawat, 2011). The idea of depicting the use of land in a map was first conceived by Saucer in 1919. Stamp in Britain is given a contribution regarding land use mapping study. The concept of land use has been defined by Stamp in 1962. The land should fulfill all the necessary and legitimate needs of the nation (Stamp, 1930). According to Nanavati conservation of land is also connected with land use (Nanavati, 1951). This needs strong scientific, rational and economic preparation to use the available resource of land, on another side we have to maintain ecological and socio-economic balance (Mohammad, 1980). The land use and land cover are indispensable for human development (Doke, 2017).
The development in the remote sensing and Geographical Information System environment present day support to the change detection as well as monitoring of earth surface resources (Aher and Dalvi, 2012). The land use is the result of a combination of both natural genesis and human influences which have been brought to bear on it in the past and of those which are still active in the present (Vink, 1975). Satellite remote sensing imagery and it’s coupled in GIS environment for land use/land cover analysis is a key to many diverse applications such as environment, forestry, hydrology and agriculture (Parlhad and Deore, 2010). Any areas natural resource management watershed management (Deshmukh et al., 2012) planning and monitoring depend on accurate information about the land cover in a region. The accurate representation of terrestrial vegetation is a key requirement for global change research (Jung et al. 2006; Lambin et al. 2001).The vegetation map is an essential base map for managing natural resources as vegetation provides a base for all living beings and plays an essential role in affecting global climate change, such as influencing terrestrial CO2 (Xiao et al. 2004). In order to initiate vegetation protection and restoration programs, it is necessary to obtain the current status of vegetation cover (Egbert et al. 2002; He et al. 2005). The traditional methods such as field surveys, literature reviews, map interpretation and collateral and ancillary data analysis, are not effective to acquire land use and land cover because they are time consuming, date lagged and often too expensive. In recent decade remote sensing techniques are being widely used for land use and land cover mapping and change dictation (Boyd et al., 2003; Ingram, 2005; Lu et al., 2004; Maynard et al., 2007; Dadhwal et al., 2009) which measures the spectral reflectance of the land cover (Zianis et al., 2005).
The remotely sensed spectral signatures are used for understanding the nature of vegetation characteristics however, it is affected by various factors like vegetation composition, soil characteristics, atmospheric conditions, topography and moisture content (Chen and Wang, 2008). Remote sensing has been the only feasible way of acquiring vegetation information over vast areas at a reasonable cost and acceptable accuracy due to repetitive data collection at a feasible effort (Lu, 2006). The developments in sensor technology have allowed the acquisition of remotely sensed data at a various range of scales ranging from coarse spatial resolution of 500 m (e.g., NOAA AVHRR, MODIS) to medium spatial resolution of 20_30 m (e.g., Landsat TM, Landsat ETM+, SPOT HRVIR) as well as high spatial resolution of less than 5 m (e.g., Ikonos, Quick Bird, LIDAR, and others). The coarse spatial resolution optical sensors such as NOAA AVHRR (Dong et al., 2003) and MODIS (Baccini et al., 2004) have been useful for mapping vegetation at the global, continental, national and regional scale, because of spatial resolution, image coverage and high frequency in data acquisition (Lu, 2006).
The medium resolution satellite imagery such as Landsat TM is used at regional and at a local scale for vegetation mapping. The Landsat Thematic Mapper (TM) use in Land use and Land cover mapping (Hall et al., 2006; Heiskanen, 2006; Ingram, 2005; Lu, 2006; Lu et al., 2004). The thematic mapper (TM) is an advanced, multispectral scanning, earth resources sensor designed to achieve higher image resolution, sharper spectral interval, improved geometric fidelity, and greater radiometric accuracy and resolution than that of the MSS sensor.
Study Area:
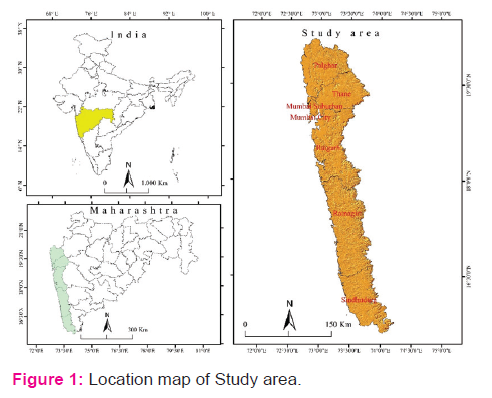
Konkan Region is one of six administrative divisions of Maharashtra State in India. Konkan is the west division in the state, with an administrative headquarters in the city of Mumbai and it is also state capital as well as finical capital of India. Amravati and Nagpur divisions makeup the region of Vidarbha. The seven districts i.e. Mumbai City, Mumbai Suburban, Raigad(Alibag), Ratnagiri, Sindhudurg, Thane and Palghar (1stAugust 2014)is included in the Konkan Region shown in Figure 1. Total area is 36,740 square km, total population 28,739,397and literacy 98.88 percent.
The ‘Konkan’ is the narrow strip of the coastal land situated between Arabian Sea and Western Ghats escarpment. The famous Western Ghats is lying in the ‘Konkan’. ‘Damanganga’ River separating Maharashtra and Gujrat States forms the northern limit of ‘Konkan’. In the south it extends up to ‘Terekhol’ Creek. The ‘Konkan’ strip is extended for about 720 km in north-south direction and is a distinct physiographic region of the State. The ‘Konkan’ region forms dissected topography and its average East-West extension is 40-50 km which varies considerably within the coastal lowland and decreased from north to south (Karlekar, 2002). Width of the region decreases as one proceeds toward south. The widest stretch is about 110 km in Ulhas river basin in north Thane District (Jog et al., 2002). Elevation of most of the ‘Konkan’ lies below 200 m ASL. The area of ‘Konkan’ varies in lithology, geomorphic configuration, nature of hinterland and climate. ‘Konkan’ region of Maharashtra can be conveniently divided into North ‘Konkan’, Middle ‘Konkan’ and South ‘Konkan’. These division is based on Physico- climatic characteristics of the region suggested by Dikshit (1986).
Objective:
To classification of Land Use and Land Cover using Remote Sensing Data in Konkan Region.
Materials and Methods:
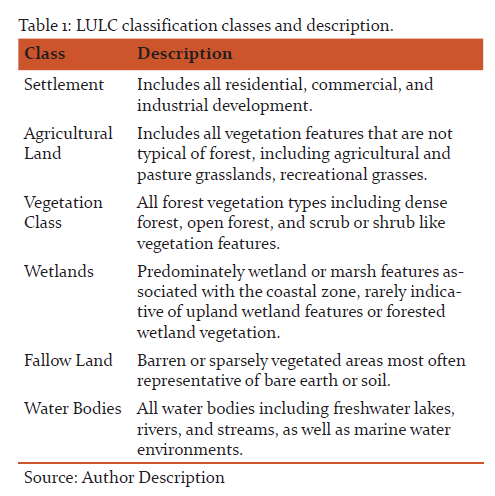
Landsat TM FCC (bands 4, 3 and 2, scale 1: 50,000, December, 2016) were used for this study. Using Erdas Imagine software 14, downloaded Landsat images were mosaiced together and Project to UTMWGS 84 coordinate system. The study area was extracted by subsetting from the whole image. The flowchart of the research methodology can be divided into five stages: (i)preparation of reference maps for gathering the existing and relevant information in the spatial form, (ii) pre-field classification of the satellite data, (iii) ground truthing, (iv)post-field correction and (v) field verification of the final map. The spectral variation of each vegetation type was extracted from digital data by interpreting satellite images based on the interpretation elements such as the image color, texture, tone, pattern and association information etc. The standard "falsecolor" composite. Vegetation looks in shades of red. Coniferous trees will seem darker red than hardwoods. For land cover and land use study, this is a very standard band combination. Typically dark red color indicates healthy vegetation covers including wide leaf and light red color indicates sparsely vegetated land cover which includes grass land areas. Diverse methods have been developed to do this. Those methods can be broadly grouped into unsupervised classification or supervised classification depending on whether or not true ground data are inputted as references (table 1). The flow chart of the research methodology is shown in Figure 2.
Result and Discussion:
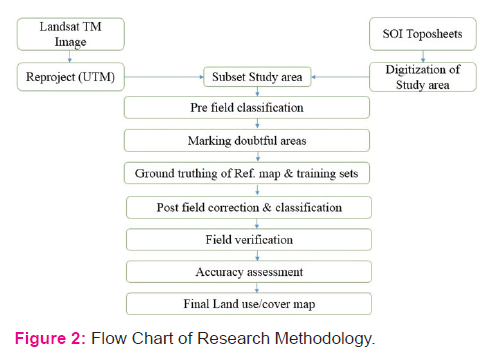
The entire area of the study is almost flat only north western part is hilly. Figure 3 represent the physical division of the study area. The vegetation map inferred from image classification is considered accurate if it provides a true representation of the region it portrays (Foody 2002; Weber 2006). The rectified Landsat TM scenes covering districts were analyzed to generate the vegetation map. All the major forest classes (viz. dense forest, open forest, scrubs) were classified. Along with forest, other land use/cover classes (viz. cropland, fallow land, wetland, settlement and water bodies) found in the Konkan Region. Table 1 gives the statistics of the study area generated from the classified output of the Landsat TM data. Table 2 shows the spatial extent of land cover in square kilometer and in percentages.
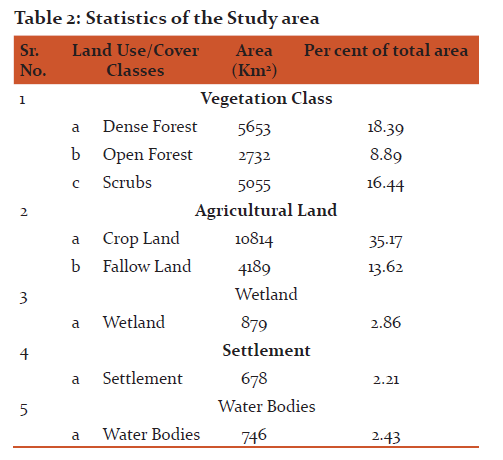
The total forest area is 43.72 (13440 square km) percent of the total geographical area of the Konkan Region. The moist dense forest constitutes the bulk of the total forest area and was found in around the west side of Western Ghat (fig.4). Open forest covers 2732 square km (8.89 Percent) and Scrubs cover 5055 square km (16.44 Percent). Agriculture covers the larger area of Konkan region 10814 square km (35.17 Percent).
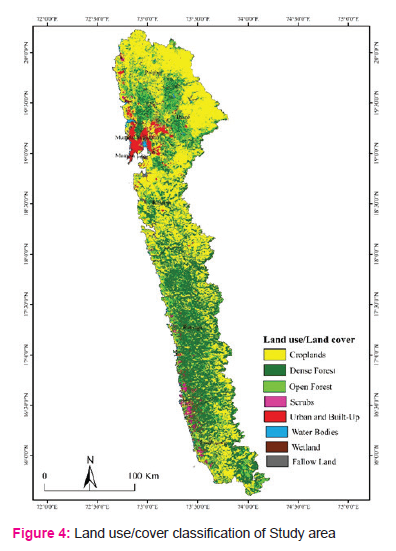
Wetland cover the small area around 879 square km (2.86 Percent). The water bodies cover 2.43 percent (746 square km) area. Open land and scrub land covers an area of 16.44 per cent. The table 2, gives the land use/cover statistics of Konkan Region generated from the classified output of the Landsat TM data. The main tree species of this forest are Ain (Terminalia tomentosa), Jambha (Xylia dolabriformis), Kinjal (Terminalia paniculata), Sagwan (Tectona grandis), Surangi (Mammeasuriga), Kokam (Garcinia indica), Kumbha (Careya arbprea), Karmal (Dillenia pentagyna), Amba (Mangifera Indica), Bibba (Semecarpus anacardium), Asana (Bridelia
retusa), Anjani (Memocylon umbellatum ), Shisham (Dalbergia latifolia), and Khair (Acacia catechu . At several locations, the forests were found in the varying stages of degradation. The output classified map is shown in Figure 4. The accuracy assessment in the first stage is done by visual inspection of derived maps; however, the method is highly subjective and often not
accurate. The second stage is more objective methods in which comparisons of the area extents of the classes in the derived thematic maps (e.g. the percentage of a specific vegetation group in the area) are made with the corresponding extents on ground or in other reference datasets. Accuracy assessment for the forest mapping was done with randomly selected sample distribution points on the ground and tallied with represented data. The classification was validated with 180 randomly selected sample points. The total accuracy of the forest cover mapping, therefore, comes to be 82.12%. The discrepancy in the forest area may be due to time on which the satellite data for the present study was acquired.
Conclusion:
The present study demonstrated the effective role of the spatial technologies in land use and cover types. The results of land use and cover mapping from remote sensing imagery represent well with the actual land cover community composition. The optimal use of satellite imagery in land use and cover mapping is effective when it is complemented with fieldwork. When selecting a right vegetation classification system for better classification accuracy, the following points should be taken into consideration (i) refining class definitions to decrease ambiguity, (ii) adding sufficient number of new classes to describe the complexity of local vegetation patterns and (iii) using a higher level of classification (Rapp et al. 2005). To map vegetation under such circumstances various difficulties are often encountered hence it is better to adopt more advanced image classification method such as sub-pixel analysis (Lee and Lathrop 2005). Another solution is to choose higher resolutions of imagery so as to increase the distinguishable possibility in image classification (Cingolani et al. 2004), however higher resolutions of imagery will most likely increase the cost. Though there are some standard methods for image preprocessing, however, there are no super image classifiers that can be uniformly applicable to all applications, hence it is hot research topic, to apply effective classifiers or to develop new powerful classifiers suitable for specific applications. The present study can be used as baseline information for policy and decision makers to develop sound management strategies for effective natural resource management as well as regional planning for the study area (Konkan Region).
References:
Aher, S.P. and Dalvi, S.N. Remote Sensing Technique for Monitoring the Glacier Retreating process and Climatic Changes Study. Indian Streams Research Journal 2012;2(8):2-6.
Aher, S.P., Parande, A.N., Deshmukh, P.P.A Geometrics of the Image Processing: Image Georeferencing. Proceedings published by International Journal of Computer Applications, 2011:20-23.
Baccini, A., Friedl, M.A., Woodcock, C. E., Warbington, R. Forest biomass estimation over regional scales using multisource data. Geophysical Research Letters 2004;31(L10501):1-4
Baret, F., and Guyot, G. Potentials and limits of vegetation indices for LAI and APAR assessment. Remote Sensing of Environment1991; 35(1-2):161-73.
Bhagawat, R. Application of Remote Sensing and GIS: Land Use/Land Cover Change in Kathmandu Metropolitan City, Nepal.Journal of Theoretical and Applied Information Technology 2011:72-80.
Buddenbaum, H., Schlerf, M., Hill, J. Classification of coniferous tree species and age classes using hyperspectral data and geostatistical methods. International Journal of Remote Sensing 2005; 26(24):5453-6.
Champion, H.G. and Seth, S.K. A Revised Survey of the Forest Types of India. Govt. of India Publications, New Delhi; 1968.
Chen, G., and Wang, J.W. Spectral reflectance and aboveground biomass estimation of the grassland under protection condition. Journal of Yunnan Agricultural University 2008; 23:462-7.
Cingolani, A.M., Renison, D., Zak, M.R., Cabido, M.R. Mapping vegetation in a heterogeneous mountain rangeland using Landsat data: An alternative method to define and classify land-cover units. Remote Sensing of Environment 2004;92(1):84-97
Dadhwal, V.K., Singh, S., Patil, P. Assessment of phytomass carbon pools in forest ecosystems in India. NNRMS Bulletin 2009:41-57.
Deshmukh, K.K. and Aher, S.P.Particle size analysis of soils and its interpolation using GIS technique from Sangamner area, Maharashtra, India. International Journal of Environment Science 2014;3(10):32-7.
Deshmukh, P., Wawale, S., Aher, S.P., Thorat, S. Demarcation of Drainage Network for Watershed Management of Sangamner Tahsil using Topographical and Remote Sensing Database.Indian Stream Research Journal 2012;2(1):1-4.
Dikshit, K.R. Maharashtra in Maps, Maharashtra state Board for Literature and Culture, Bomba, 1986:p.245.
Doke, A. B. Land use/Land cover mapping of Nagpur Region (MS). Research Journal of Science and IT Management 2017;6:6-13.
Dong, J., Kaufmann, R.K., Myneni, R.B., Tucker, C.J., Kauppi, P.E., Liski, J., Buermann, W., Alexeyev, V., Hughes, M.K. Remote sensing estimation of boreal and temperate forest woody biomass: carbon pools, sources and sinks. Remote Sensing of Environment 2003; 84:393-410.
Egbert, S.L., Park, S., Price, K.P., et al. Using conservation reserve program maps derived from satellite imagery to characterize landscape structure. Computers and Electronics in Agriculture 2002; 37(1-3):141-56.
Foody, G.M. Status of land cover classification accuracy assessment. Remote Sensing of Environment2002; 80(1):185-201.
Foody, G.M., Boyd, D.S., Cutler, M.E.J. Predictive relations of tropical forest biomass from Landsat TM data and their transferability between regions. Remote Sensing of Environment 2003; 85(4):463-74.
Freeman, T.W. Geography and Planning. Hutchinson, University Library, London; 1968.
Gajbhiye, S. and Sharma, S.K. Land Use and Land Cover change detection of Indra river watershed through Remote Sensing using Multi-Temporal satellite data. International Journal of Geomatics and Geosciences2012; 3(1):89-90.
Hall, R.J., Skakun, R.S., Arsenault, E.J., Case, B.S. Modeling forest stand structure attributes using Landsat ETM+ data: Application to mapping of aboveground biomass and stand volume. Forest Ecology and Management 2006; 225(1-3):378-90.
He C, Zhang Q, Li Y, et al. Zoning grassland protection area using remote sensing and cellular automata modeling-a case study in Xilingol steppe grassland in northern China. Journal of Arid Environment 2005; 63(4):814-26.
Heiskanen, J. Estimating aboveground tree biomass and leaf area index in a mountain birch forest using ASTER satellite data. International Journal of Remote Sensing 2006; 27(6):1135-58.
India State of Forest Report. Forest Survey of India, FSI (Ministry of Environment and Forest), Dehradun, India 2009.
Ingram, J.C., Dawson, T.P., Whittaker, R.J. Mapping tropical forest structure in southern Madagascar using remote sensing and artificial neural networks.
Remote Sensing of Environment 2005; 94: 491-507.
Jog, S.R., Wakhare, A., Chaudhuri, S., Unde, M., Pardeshi, S.D. Maharashtra Landscape: A Perspective, In: Diddee, J., Jog, S.R., Kale, V.S., Datya V.S. (Eds.) Geography of Maharashtra. Rawat Publication, Jaipur 2002:19-57.
Jung, M., Churkina, G., Henkel, K., Herold, M., Churkina, G. Exploiting synergies of global land cover products for carbon cycle modeling. Remote Sensing of Environment2006; 101:534-53.
Karlekar S.N. Geomorphology of the Konkan coast, In Diddee, Jaymala, Jag, S.R., Kale, V. S., Datye, V.S. (Eds). Geography of Maharashtra. Rawat Publications, Jaipur 2002:58-71.
Lambin, E.F., Turner, B.L., Helmut, J., et al. The causes of land-use and land-cover change: moving beyond the myths. Global Environment Chang 2001; 11(4):261-9.
Landsat TM FCC, (landsat thematic mapper, false colour composite) http://gisgeography.com/usgs-earth-explorer-download-free-landsat-imagery/(accessed on December 2016).
Lee, S., Lathrop, R.G.Sub-pixel estimation of urban land cover components with linear mixture model analysis and Landsat Thematic Mapper imagery. International Journal of Remote Sensing2005; 26(22):4885-905.
Lu, D., Mausel, P., Brondizio, E., Moran, E. Relationships between forest stand parameters and Landsat TM spectral responses in the Brazilian Amazon Basin. Forest Ecology and Management2004; 198(1-3):149-67.
Maynard, C.L., Lawrence, R.L., Nielsen, G.A., Decker, G. Modeling vegetation mount using band wise regression and ecological site descriptions as an alternative to vegetation indices. GIScience and Remote Sensing2007; 44(1):1-14.
Mohammad, N. Investigating Land Use and Land Cover Change in Bahrain: 1987-2013.Geospatial Technologies project 1980.
Nanavati, M.B. and Anjaria, J.J. The Indian Rural Problem. Vora and Co. Bombay 1951.
Pralhad, Y.V. and Deore, R.S. Population Growth and Changing Land use Profile in Girna River Basin in Nashik District (MS).International Research Journal2010;1(3-4):11-12.
Rapp, J., Lautzenheiser, T., Wang, D., Cepan, D., Thompson, E. Evaluating error in using the national vegetation classification system for ecological community mapping in Northern New England, USA. Nat Areas Journal2005; 25(1):46-54.
Stamp, L.D. Applied Geography. Penguin Books, Suffolk 1930;105-7.
Vink, A.P.A. Land Use in Advancing Agriculture.Springer-Verlag Berlin Heidelberg New York 1975; 3:3-17.
Weber, K.T.Challenges of integrating geospatial technologies into rangeland research and management. Rangeland Ecology and Management2006; 59(1):38-43.
Xiao, X., Zhang, Q., Braswell, B., Urbanski, S., Boles, S., Wofsy, S., Moore, B., Ojima, D. Modeling gross primary production of temperate deciduous broadleaf forest using satellite images and climate data. Remote Sensing of Environment2004; 91(2):256-70.
Zianis, D., Muukkonen, P., Makipaa, R., Mencuccini, M. Biomass and stem volume equations for tree species in Europe. Silva Fennica Monographs 2005; 4:1-63.
|
 IJCRR
IJCRR 


 This work is licensed under a Creative Commons Attribution-NonCommercial 4.0 International License


