IJCRR - 3(6), June, 2011
Pages: 116-133
Print Article
Download XML Download PDF
CLIMATE CHANGE AND DROUGHT HAZARD IN HILLS: A BURNING HYDRO-METEOROLOGICAL PROBLEM INVESTIGATED THROUGH REMOTE SENSING AND GIS MODELING
Author: Pradeep K. Rawat, P.C. Tiwari, Charu C. Pant
Category: General Sciences
Abstract:The main objective of the study was to assess the impact of climate change on drought hazards through integrated Database Management System (DMS) on three GIS (Geographical Information System) modules i.e. climate informatics and land use-informatics and hydro-informatics. The Dabka watershed constitutes a part of the Kosi Basin in the Lesser Himalaya, India in district Nainital has been selected for the case illustration. Hydro-informatics module consists of daily, monthly and annual record of spring hydrology and stream hydrology of study area. Land use informatics consists of land use mapping and change diction i.e. decadal changes and annual changes whereas the Climate informatics module consists of spatial distribution of climate and its change detection through daily, monthly and annual weather data (temperature, rainfall, humidity and evaporation) of two study periods i.e. during 1985-1990 and 2005- 2010. The spatial distribution of climate throughout study area suggesting three types of climatic zones i.e. sub-tropical, temperate and moist temperate which are respectively favorable for mixed forest, pine forest and oak forest in the mountain eco-system. The results of climate-informatics advocating that all these climatic zones shifting towards higher altitudes due to global climate change and affecting the favorable conditions of the existing land use pattern. In order to that the oak and pine forests have decreased respectively by 25 % (4.48 km2) and 3% (.28 km2) during the period of 1990 to 2010. The
results also advocated that the overall accelerating factor of land use degradation in the study area broadly categorizes as dominant factor and supporting factor. Out of the total seven classes of the land use land cover, five classes (i.e. Oak, Pine, Mixed, Barren and Riverbed) are being degraded dominantly due to climate change factor and anthropogenic factors plays a supporting role whereas only two classes (Scrub land and agricultural land) are being change dominantly by anthropogenic factors and climate change factors plays a supporting role. Expansion of mixed forest land brought out due to upslope shifting of existing forest species due to climate change factor only because upslope areas getting warmer than past with the rate of 9?c-12?c/two decades. Consequently the results concluded that the high rate of land use degradation accelerating drought hazard during non-monsoon period as dry-up of natural springs and decreasing trends of stream discharge etc. This has serious implications on livelihood and food securities as natural springs and streams constitute the main source of drinking water and irrigation in the region.
Keywords: Climate Change, Land use Degradation, Decreasing Water Resources, Drought
Full Text:
INTRODUCTION
Drought occurs over most parts of the world, even in wet and humid regions. It is a recurring extreme climate event over land characterized by below-normal precipitation over a period of months to years. This is because drought is defined as a dry spell elative on its local normal condition. On the other hand, arid areas are prone to drought because their rainfall amount ritically depends on a few rainfall events. Through out the world mainly three types of drought have been identified i.e. meteorological drought, agricultural drought and hydrological drought (Dai, 2011). Meteorological drought is a period of months to years with below-normal precipitation. It is often accompanied with above-normal temperatures, and precedes and causes other types of droughts. Agricultural drought is a period with dry soils that results from below-average precipitation, intense but less frequent rain events, or above-normal evaporation, all of which lead to reduced crop production and plant growth. Hydrological drought occurs when river stream flow and water storages in spring aquifers, lakes, or reservoirs fall below long-term mean levels. But the proposed study investigated that the Himalaya hills experiencing all three types of drought in same time period in a particular area due to climate change and land use degradation. In order to that the present study suggesting integrated approach of drought i.e. hydrometeorological drought which include all aspect of drought either it is agricultural drought, hydrological or meteorological drought because agriculture system in mountainous terrain completely depends on hydrological and meteorological parameters. A lack of precipitation often triggers hydro-meteorological droughts, but other factors, including more intense but less frequent precipitation, poor water management, and erosion, can also cause or enhance these droughts. Dwarfing all other mountains of the world in sheer height, Himalaya is the youngest mountain system, which is still undergoing tectonic movement due to prevailing geological conditions. Though each and every part of the world is more or less susceptible to natural calamities, the Himalaya due to its complex geological structures, dynamic geomorphology, and seasonality in hydro-meteorological conditions experience natural disasters very frequently, especially water-induced hazards (Rawat et. al., 2011). Climate change and land use degradation through flash flood, river-line flood, erosion, non-seismic land slide in monsoon period accelerating hydro-meteorological drought hazard as drying up of natural water springs and decreasing streams discharge in non-monsoon period particularly during summer season (April-June). The geodynamically active Himalayan terrain is being deforested at the rate of 0.36km2 /year (Rawat and Pant, 2007 and Rawat et al 2010). There are several anthropogenic factors that may contribute to this acceleration, including poorly managed agriculture, forest fire, overgrazing, and substandard construction of roads and buildings. Increasing population and demand of land for agriculture has resulted in pressure in the watershed of the Lesser Himalayan region (Rawat et al. 2011). This is further evident by upslope shifting and destruction of forest land due to climate change. An attempt has been made in the present study to assess the trends of land use pattern in a fragile watershed located near a seismic and tectonically active region of Himalya. The watershed lies between the latitude 29°24'09"– 29°30'19"E and longitude 79°17'53"-79°25'38"N in the north west of Nainital Township (Fig.1). The region encompasses a geographical area of 69.06 km2 between 700 m and 2623 m altitude above mean sea level. The total population of the watershed is 9250 people, which includes 16 Villages. The population density is 76.02 person /km2. . About 95% population of the total population depends on agriculture and forest resources but the forest cover is decreasing 0.36 km2 per year and the agricultural production also decreasing due climate change and drought hazard. The Geographical Information system (GIS) and Remote Sensing (RS) techniques have recently been widely applied to study land use/land cover changes (Mohanty, 1994; Minakshi et al., 1999; Brahmabhatt et al., 2000; and Chauhan et al., 2003). In Himalaya, a variety of changes have emerged in the traditional resource utilization structure mainly in response to population growth and resultant increased demand of natural resources, ineffective technology transfer, market forces, inappropriate land tenure policies, faulty environmental conservation programs, irrational rural developmental schemes, and increasing economic and political marginalization, during the recent years (Palni et al., 1998; Tiwari and Joshi, 1997). These emerging negative trends in the socio-economic profile have resulted into rapid exploitation and transformation of land resources and large-scale land use changes in the region (Tiwari, 1995). Under the impact of various land use systems, the land and whole environment of a geographical region changes positively or negatively. The impact of some land use changes is limited to the area in which they are operated while that of others reaches far in the surrounding ecosystems (Kostrowicki, 1983). The extensive land use changes in Himalaya have not only disrupted the fragile ecological balance of the watersheds in the region through deforestation, erosion, landslides, hydrological disruptions, depletion of genetic resources, but have also threatened the livelihood security and community sustainability in mountains as well as in adjoining plains ecosystem (Tiwari, 2000; Tiwari and Joshi, 2002 and 2005). The high rate of land use change accelerating several environmental problems such as high monsoon runoff, flash flood, river-line flood, soil erosion and denudation during monsoon season and drought during non-monsoon period as dry-up of natural springs and decreasing trends of stream discharge etc. These environmental problems cause great loss to life and property and poses serious threat to the process of development with have far-reaching economic and social consequences. Land use degradation due to climate change effecting water resources as drying up of natural water springs and decreasing trends of streams discharge and as a whole triggering other hydrological hazards such as high runoff, flash floods, river-line floods and non-seismic landslide etc. which are mainly responsible for several socio-economic consequences in mountainous terrain (Ives, 1989; Valdiya and Bartarya, 1989; Cruz, 1992; Jain et al, 1994; Sing, 2006; Rawat et. al., 2010). Flash flood in the region cause great loss to life and property and poses serious threat to the process of development with have far-reaching economic and social consequences. About hundreds of peoples are losing their life each year due to flash flood hazard in Himalaya region. On the other hand the river-line flood triggering several environmental socio-economic problems in many ways. River-line flood is undercutting of valley sides which causes the mountainsides to become unstable and ultimately ends in landslides and slope instability which demolished the infrastructural development (road network, buildings, canals, communication connectivity etc) and natural resources specially forest, land and water. During floods, tremendous amounts of erosion occurs on the banks of rivers and streams and washed away the crops and productive land whereas some time moreover, unsorted sediments are deposited over agricultural fields and settlements especially during monsoons.
METHODOLOGY
The study comprises mainly two components, (a) lab/desk study and (b) field investigations. The procedure adopted for study has been outlined in Fig. 2 which depicting that study carried out through GIS database management system (DMS). GIS-DMS is a set of computer programs for managing an integrated spatial and attribute database for such a task as map and data input storage, search, retrieval, manipulation and output. Existing DMS is constituted of three different GIS modules consisting of spatial map layers with their attribute data. These three GIS modules are: climate-informatics, land use-informatics and hydro-informatics respectively for climate change, land use degradation and drought hazard and its socio-economic and environmental risks assessment as describing below lines:
Climate Change Assessment
To assess the climate change during last twenty five years, a comprehensive meteorological study carried out for period 2005-2010 and compared the results of this study with previous study carried out during 1985-1990 (Bight, 1990) from the same study area (i.e. Dabka watershed). Consequentially the spatial distribution of climate throughout study area has been carried out as subtropical climate, temperate climate and moist temperate climate in respect to meteorological data of both study periods. These meteorological data recorded at five meteorological observatories. Four observatories located in sample micro-watershed established at different elevation and running by geology and geography department of Kumaun University and one located at lower elevation of the study area established and running by Irrigation Department of Uttarakhand state government. The four meteorological station running by Kumaun University funded by Govt. of India under different agencies as per their requirement i.e. Department of Environment (1985-1990), Department of Science and Technology (2005-2010) government of India. The meteorological records for a period of twenty five years (1985-2010) depicting that the lowest annual average temperature (18? c) found in year 1990 whereas year 2010 experienced highest annual average temperature (27? c) that‘s why those years determined as a base years to analysis the climate change and its impact on land use pattern which accelerating several ecological risks through high rate of runoff, rive line flood, flash flood and erosion etc. In order to that the elevation levels of the each meteorological observatory have been determined to delineate isotherms for year 1990 and 2010 and carryout spatial distribution maps of climate for respective year and than superimposed theses spatial distribution maps over the land use map for year 1990 and 2010 to detach the specific impact of climate change on the particular categories of land use land cover.
Land Use Land Cover Mapping and Change Detection
Indian Remote Sensing Satellite (IRS-1C) LISS III and PAN merged data of 1990 and 2010 was used for the analysis and mapping of land cover/ land use for the respective years (Fig. 2). Supplementary data and information required for the study have been generated from various primary as well as secondary sources. The primary information was generated through field surveys, mapping, interviews etc., and the relevant secondary data was collected from various sources, such as, Census of India – 2001, Government, Land Records, forests maps etc. Radiometric corrections were done employing dark pixel subtraction technique. The satellite images of the study area were registered geometrically using SOI Topographical Sheets (56 O/7NE and 56 O/7NW) of the area at scale 1:25000. For carrying out this important exercise uniformly distributed common Ground Control Points (GCPs) were selected and marked with root mean square (rms) error of one pixel and the images used were resampled by cubic convolution method. Both the data sets were then co-registered for further analysis initially, the LISS and PAN data were co-registered with root mean square (rms) error of 0.3 pixel and the output FCC was transformed into Intensity, Hue and Saturation (IHS) colour space images. The reverse transformation from IHS to RBG was performed substituting the original highresolution image for the intensity component, along with the hue and saturation components from the original RBG images. This merge data product obtained through the fusion of IRS –1C LISS – III and PAN was used for the generation of land cover/land use map of the study area for the year 2001, and digital image processing techniques supported by intensive ground truth surveys were used for the interpretation of the remote sensing data (Fig. 2). In order to enhance the interpretability of the remote sensing data for digital analysis several image enhancement techniques, such as, PCA, NDVI etc. were employed (Fig. 2). In the Himalayan mountain terrain the interpretability of the remote sensing data to a large extent is affected by the complexity of the terrain as due to the effect of elevation and slope and its aspect, the spectral signature of same objects are often different or vice versa. In order to overcome these constraints and also to attain the best possible level of accuracy in the interpretation, intensive ground truth surveys were carried out in the study region and a visual interpretation key was evolved for primary land cover/land use classification (Table 1). This was followed by the digital classification of land cover/ land use through on screen visual recording and rectification. To monitor the dynamics of land utilization pattern in the study area the land use maps generated for the years 1990 and 2010 were overlaid using Geographic Information System and land use changes were detected and mapped (Fig. 2). The geo-hydrological impacts of land use degradation due to climate change carried out for drought hazard and its risks appraisal (Rawat et. al., 2011).
Drought Hazard and Risks Appraisal
A comprehensive geo-hydrological study on spring hydrology and stream hydrology carried out during 2005-2010 and compared the results with the previous hydrological study (Bisht, 1990) to assess the impacts of climate change and land use degradation. Spring hydrology comprises of spatial distribution of different types of springs in respect to their discharge pattern (i.e. perennial non perennial and dried springs) and spring density. Stream hydrology comprises of spatial distribution of different types of stream (i.e. perennial non perennial and dried streams) and their density and frequency. The measurement techniques of spring and stream hydrology followed suggested by Rawat et al. 2011. In order to that a draught hazard and risks map carried out through integration of climate change, land use and hydrological database following scalogram modeling approach (Cruz, 1992).
RESULTS AND DISCUSSIONS
Climate-informatics The climate-informatics module consists of comparative study of climatic parameters for a twenty years period during 1990 to 2010 to appraise the impacts of climate change on land use pattern because it‘s reversely influences the ecology of the watershed and accelerated several environmental and socio-economic risks through high runoff, erosion and sediment delivery during rainy season. Monthly and annual climate data records of two study periods is used to climate spatial distribution mapping for respective year (Table 2 and Fig. 3). A brief account is as follows:
Temperature: The average temperature of the Dabka Watershed is 27ºC in present (2010) and it was about 18ºC twenty years back in 1990 although it varies altitude wise throughout the study area (Table 2 and Fig. 3). June is the driest and hottest month and receives highest annual temperature on the south-facing barren land whereas January is coldest month and receives minimum annual temperature. The annual maximum average temperature found 37ºC in 2010 whereas it was just about 23ºC twenty years back in 1990 (Table 2). The annual minimum average temperature recorded 12ºC in 1990 whereas it is has been rise up to 17ºC in present time by year 2010 (Table 2).
Rainfall: Throughout the watershed the average annual rainfall is about 2000 mm whereas twenty years back during 1985-1990 it was 2120 mm (Table 2). The results suggested that the annul rainfall pattern has been change and also experiencing that the rainfall season shirking by one to two months (August to September) with the characteristics of extreme rainfall within very small time period which becomes a big threat for hydrological hazards such as erosion, sediment delivery flood landslide and denudation etc. whereas the rainfall records by twenty year back depicting that the rainy season covered completely four months (June to September) having moderate rainfall pattern.
Humidity: The twenty year data analysis suggested that the average annual humidity of the watershed stands at 83.4% which varies between 86% in the dense oak forest area and 64.5% in the south-facing barren land. On other ecological conditions it stands at 80.7% in fairly dens forest/shrub land, 78.5% on the agricultural land agricultural land area. Table 2 suggesting that the average humidity was high than present it has been decreased by 8% annual due to climate change.
Evapotranspiration Loss: The twenty year data analysis suggested that the present annual evapotranspiration loss of the watershed is about 602.43 mm whereas twenty year back it was quit low about 535.57mm. Presently its approaches maximum up to 1072.3 mm on the south-facing barren land and drops down to 559.4 mm on the north-facing oak forest areas of the watershed. On other environmental conditions it was found 786.7 mm, 811.4 mm on the fairly dens forest/shrub land, agricultural land area respectively.
Spatial Distribution of Climate Change: The meteorological records for twenty five years (1985-2010) depicting that the lowest annual average temperature (18? c) found in year 1990 whereas year 2010 experienced highest annual average temperature (27? c) that‘s why those years determined as a base years to analysis the climate change and its impact on land use pattern which accelerating ecological degradation through deforestation, land degradation, instant rainfall, high monsoon runoff, flash floods, erosion and sediment delivery etc. (Rawat et al. 2011). The climate spatial distribution maps of two study periods (i.e. 1985-1990 and 2005-2010) advocating that all the existing climatic zones (i.e. sub-tropical, temperate and moist temperate) spreading towards higher altitudes due to global climate change and degrading the natural favorable climatic condition of the mixed forest, pine forest and oak forest i.e. respectively subtropical, temperate and moist temperate climate (Table 3 and Fig. 3). The results also advocating that the rates of the climate change are high in mountainous areas in compare to plain areas (Table 3 and Fig. 3). It means the rates of climate change are increasing in respect to higher elevation which dominantly effecting the natural vegetation covers throughout the Himalaya up to snow line (6000m). Above the snow line it‘s also affecting the snow cover which could be the major reason for malting of glaciers in the Himalaya which is a great threat to costal ecosystem due to rising of sea level. In order to monitor the impacts of climate change on land use pattern, the land use interpretation was carried out under land use-informatics module for the years 1990 and 2010 using IRS LISS–III and PAN merged data of respective years.
Land Use-informatics As mentioned in methodological section that the land use-informatics module consists of comparative land use land cover mapping for year 1990 and 2010 to assess the changes and identified the accelerating factors for the this changes as discussed in below.
Land Use for year 1990: On the basis of the above exercise, 7 land cover/land use classes could be identified in the study area, for 1990 and 2010 (Fig. 3). Besides the interpretation of the principal land use categories, all the major forest types available in the region could also be identified and mapped during the digital interpretation process. The land use/land cover maps of the study region have been prepared on the scale 1:25000 and classified into 7 categories for both the years (1990 and 2010). The land use classes identified in the watershed include (i) Oak Forests, (ii) Pine Forests, (iii) Mixed Forests, (iv) Scrub Land, (v) Barren Land, (vi) River Beds and Water Bodies, and (vii) Cultivated Land which also includes settlements (Fig. 3). In 1996, out of the total geographical area (69.06 km2 ) of Dabka Watershed as much as 39.23 km2 or 56.81% was under forests. The forests mainly include Oak Forests, Pine Forests and Mixed Forests, which respectively account for 26.05 % (17.99 km2 ), 11.89 % (8.21 km2 ), and 18.87 % (13.03 km2 ), of total geographical area of the watershed. The scrub land and barren land were respectively extended over 6.38 km2 (9.24 %) and 2.18 km2 (3.16 %) of the watershed area. Riverbeds and water bodies occupied only 1.50 km2 or 2.17 % geographical area of the study region. Nearly 20 km2 land surface which amounts to nearly 28.63 % of the total area of Dabka Watershed was under cultivation in 1990 (Table 3 and Fig. 3).
Land Use for year 2010: The forest emerged as the major land use/land cover also in the year 2010. A geographical area of 36.77 km2 , which accounts for nearly 53 % of total area of the watershed, has been classified as forests. Due to complexities of terrain and other geomorphic features the forests of the watershed are diversified in nature. Out of the total forest 22.20 % (15.33 km2 ) is under mixed forest, 19.56 % (13.51 km2 ) is under Oak forest, and 11.48 % (7.93 km2 ) is under Pine forests (Table 3). The hilly and mountainous parts of the watershed are covered with Oak and Pine species, whereas, in the lower elevations in the south mixed type of vegetation is very common. Agriculture and settlement are now confined to 20.40 km2 or 29.54 % of the total area. Scrub land, barren land and Riverbeds and water bodies respectively extend over 6.22 km2 (9.01 %), 3.39 km2 (4.91 %), 2.28 km2 (3.30 %) of the total geographical land surface of the study area (Table 3 and Fig. 3).
Land Use Change and Degradation during 1990-2010: In order to monitor the dynamics of land transformation process land use interpretation was carried out for the years 1990 and 2010 using IRS LISS – III and PAN merged data for the respective years. The exercise revealed that oak and pine forests have decreased respectively by 25 % (4.48 km2 ) and 3% (.28 km2 ) thus bringing a decline of 4.76 km2 forest in the watershed during 1990 to 2010. But, due to climate change the mixed forest taking place of oak forest in certain pockets and consequently the mixed forest in the catchment increased by 18 % (2.3 km2 ) during the same period which reduced the overall loss of forests in the region but its not eco-friendly as the oak forest because the broad leaved and wide spread roots of oak trees helps in controlling the several hydrological hazards such as accelerated runoff, erosion, landslides, flash flood and river-line flood during monsoon period and drought during non-monsoon period. As a result, the watershed recorded a total decline of 2.46 km2 or 6% forest area during 1990 to 2010 (Table 3 and Fig. 3). The non-forest area has increased dramatically due to lopping and cutting of trees, accelerated runoff, soil erosion, and growing agricultural activities. The non-forest area has mainly been confined to barren land, riverbed and cultivated land. Barren land increased 1.21 km2 (56%), riverbed increased 0.78 km2 (52%) and cultivated land increased about 0.63 km2 (3%) during the period of 1990 to 2010 (Table 3 and Fig. 3). The results of land use dynamics presented on Table 3, advocated that the overall accelerating factor of land use dynamics in the study area broadly categoriesed as dominant factor and supporting factor. Out of the total seven classes of the land use land cover, five classes (i.e. Oak, Pine, Mixed, Barren and Riverbed) are being change dominantly due to climate change factor and anthropogenic factors plays a supporting role whereas only two classes (Scrub land and agricultural land) are being change dominantly by anthropogenic factors and climate change factors plays a supporting role. Expansion of mixed forest land brought out due to upslope shifting of existing forest species due to climate change factor only because upslope areas getting warmer than past with the rate of 9?c - 12? c/two decades (Table 3 and Fig. 3).
Hydro-informatics
A comprehensive hydrological study on spring hydrology and stream hydrology carried out during 2005-2010 and compared the results with the previous hydrological study (Bisht, 1990) to assess the impacts of climate change and land use degradation. The results suggesting that the climate change accelerating land use degradation and drough hazard as decreasing under groundwater water level, drying up water springs and decreasing trends of stream discharge as discussed below:
Decreasing Underground Water Level: Land use degradation and deforestation reduced the protective vegetal cover as a result the significant proportion of rainfall goes waste as flood water without replenishing the groundwater reserve. It is experiencing that the ground water level throughout the watershed gradually going down due to deforestation and high flood runoff. The results advocating that twenty year back during 1985-1990 the underground water was easily approachable up to 2000 m altitude whereas now it is quit difficult due to deficiency of under ground water because the water table has been gone down up to just 1200 m altitude (Fig. 4a). The decreasing trends of under ground water table affecting the spring hydrology and stream hydrology in the study area as depicting by a schematic diagram in Fig. 4a for year 1990 and 2010.
Drying up Natural Water Springs: It was observed that, ?the springs are drying-up or being seasonal due to lack of ground water recharge in the catchment and the existing springs depicting decreasing water discharge rates (Table 4). This has serious implications on water resources and on livelihood and food securities as natural springs constitute the main source of drinking water and irrigation in the region. The spatial distribution of perennial spring carried out in the region revealed that there were total 116 perennial springs in the watershed in 1990 (Bisht, 1991), out of which 52% (60) have gone dry till 2010 (Table 4 and Fig. 4b, Fig. 4c). In order to that spatial distribution of perennial spring density has been carried out which depicting four categories of density i.e. low, moderate, high and very high. All these categories suggested the decreasing trend of spring density during 1990 to 2010 (Fig. 4d).
Decreasing Trends of Stream Discharge:
In order to drying up of natural springs the streams depicting decreasing trends of annual stream discharge and becoming perennial to seasonal streams in the study area. The hydrological results suggesting that the existing average annual discharge of Dabka watershed is 13 l/s/km2 whereas during 1985-1990 it was quit high i.e. 17 l/s/km2 (Table 4). It‘s also found that due to decreasing trends of stream discharge a number of perennial streams have been dried and as a result decreasing the perennial stream frequency throughout the sturdy area (Fig. 4b and Fig. 4c). The stream frequency map depicting four categories of the spatial distribution of perennial streams frequency (low, moderate, high and very high) and advocating that perennial stream frequency has been decreased during 1990 to 2010 due to climate change through drying up of natural water springs and decreasing trends of stream discharge (Fig. 4e).
Spatial Distribution of Drought Hazard: The spatial distribution of drought hazard comprises the integrated effect of above all three types of drought (i.e. decreasing underground water, drying up springs and streams) in a unit area. In order to that throughout the study area four zones of drought hazard have been determined i.e. low, moderate, high and very high in respect to potential for drought hazard. Very high hazard zone have the maximum area i.e. about 44.20 km2 or 64% of the watershed whereas very low hazard zone have minimum area (04.83 km2 or 7% of the watershed). The low and moderate drought hazard zones accounts respectively about 08.98 km2 or 13% and 11.05 km2 or 16% areas of the watershed (Table 5 and Fig. 5a).
Socio-Economic and Environmental Risks
Appraisal of Drought Hazard
To appraise the environmental and socioeconomic consequences of drought hazards due to climate change and land use degradation in the study area, a risks zone map has been prepared. This map comprises three zones of risk potential i.e. low, moderate and high potential. Areas mainly fall under forest, wasteland, channel beds and scrubland of the watershed having low socio-economic and environmental risks and accounts maximum area about 51.37 km2 or 74% of the study area (Table 5 and Fig. 5b). Areas located along streams, on alluvial and fluvial fans having about 10 % (7.06 km2 ) area of the watershed is under moderate risk potential zone whereas 15% (10.63 km2 ) area of the watershed under human settlements, water-mills, roads, canals and cultivated land, river terraces etc. having high risks potential for socio-economy and environment.
CONCLUSION
The GIS modeling on climate-informatics and land use-informatics advocated that the overall accelerating factor of land use degradation in the study area broadly categories as dominant factor and supporting factor. Out of the total seven classes of the land use land cover, five classes (i.e. Oak, Pine, Mixed, Barren and Riverbed) are being change dominantly due to climate change factor and anthropogenic factors plays a supporting role whereas only two classes (Scrub land and agricultural land) are being change dominantly by anthropogenic factors and climate change factors plays a supporting role. Expansion of mixed forest land brought out due to upslope shifting of existing forest species due to climate change factor only because upslope areas getting warmer than past with the rate of 9 ? c-12? c/two decades. Consequently the results concluded that the high rate of land use degradation accelerating drought hazard during non-monsoon period as dry-up of natural springs and decreasing trends of stream discharge etc.
ACKNOWLEDGEMENTS
This study constitutes part of multidisciplinary Collaborated project, on “Geo-environmental Appriasal of the Dabka Watershed, Kumaun Lesser Himalaya, District Nainital: A Model Study for Sustainable Development” funded to Authors by the NRDMS Division, DST, New Delhi. Dr. Pradeep Goswami, Senior Scientist, Center for climate change, Kumaun University Nainital helped in GIS analysis for which authors indebted to him. Thanks to Shri M.S. Bargali, project assistant helped during the intensive field work.
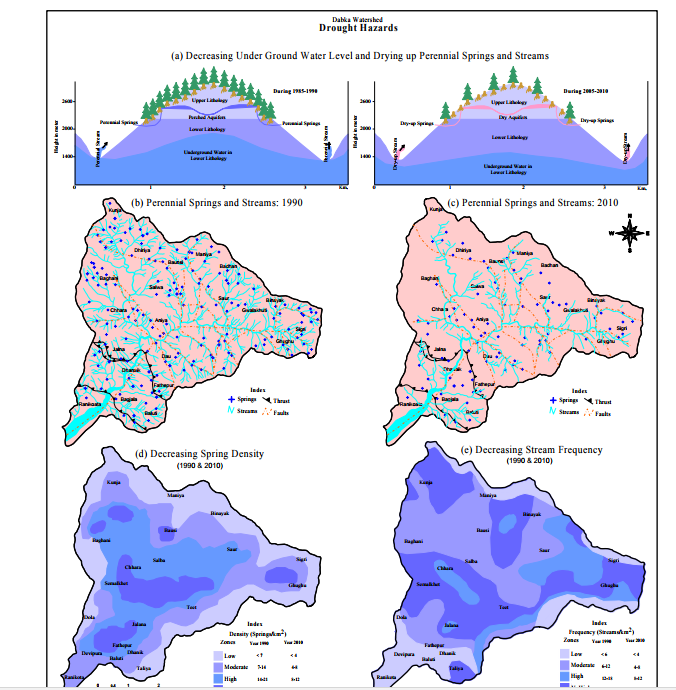
Fig. 3: Climate Zones for Year 1990 (a) and its Impact on Existing Land Use Pattern (a1), Climate Zones for Year 2010 and its Impact on Existing Land Use Pattern (b1)
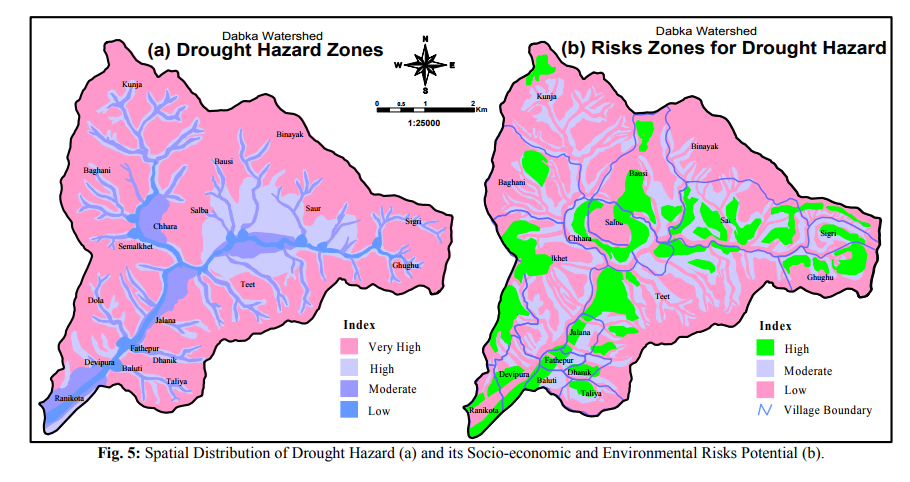
Fig. 4: Geo-hydrological Impacts of Climate Change and Land Use Degradation During 1990-2010 in Himalaya i.e. Decreasing Under Ground Water Level and Dry up of Perennial Springs and Streams depicting by Schematic Diagram (a), Decreasing Perennial Springs and Streams during 1990 and 2010 (respectively b and c), Decreasing Perennial Springs Density (d) and Decreasing Perennial Streams Frequency (e),
References:
1. Bisht MKS (1991) Geohydrological and geomorphological investigations of the Dabka catchment district Nainital, with special reference to problem of erosion. Unpublished PhD. Thesis. 37-115
2. Bora CS and Lodhiyal LS (2010) Ecological trends of under canopy species of Eucalyptus plantations in Bharbhar and Tarai region of India Central Himalaya. EInternational Scientific Research Journal. 2(2):118-127.
3. Bhatt B, Dawadi GB, Chhabra SB, Ray SS, and Dadhwal VK (2000) Landuse/land cover change mapping in Mahi Canal Command area, Gujarat, using multitemporal satellite data. Journal of Indian Society of Ramote Sensing. 28(4):221-232.
4. Chauhan PS, Porwal MC, Sharma L, and Negi JDS (2003) Change detection in Sal forest in Dehradun forest division using Remote Sensing and Geographic Information System Journal of Indian Society of Remote Sensing. 31(3):211-218.
5. Cruz RAD (1992) The determination of suitable upland agricultural areas using GIS technology. Asian pacific Remote Sensing Journal. 5:123-132.
6. Dai A (2011) Drought under global warming: a review WIREs Climate Change. 2:45-65.
7. Eckhardt K and Ulbrich U (2003) Potential impacts of climate change on groundwater recharge and streamflow in a central European low mountain range. J. Hydrol. 284:244–252.
8. Hamilton LS (1987) What are the impacts of Himalayan deforestation on the GangesBrahmaputra lowland and delta? Assumptions and facts. Mountain Research and Development. 7:256-263.
9. Ives J.D. (1989) Deforestation in the Himalaya: The Cause of Increased Flooding in Bangladesh and Northern India. Land Use Policy. 6:187-193.
10. Jain SK, Kumar S and Varghese J (1994) Estimation of soil erosion for a Himalayan watershed using GIS technique. Geol. Soc. London.151:217-220.
11. Joshi PK and Gairola S (2004) Land cover dynamics in Garhwal Himalayas- A case study of Balkhila sub-watershed. Indian Society of Remote Sensing. 32(2):199-208.
12. Kostrowicki J, (1983) Land Use Systems and Their Impact on Environment: An Attempt at and Classification. The Geographer. 30 (1):6-14.
13. Laborde E P, Gourbesville P, Assaba M, Demmak A and Belhouli A (2010) Climate evolution and possible effects on surface water resources of North Algeria. Current Science. 98 (8):1056-62.
14. Minakshi, R Chaurasiya and Sharma PK (1999) Land use/land cover mapping and change detection using satellite data-A case study of Dehlon block, district Ludhiana, Punjab Journal of Indian Society of Remote Sensing. 27(2):225-235.
15. Mohanty, RR (1994) Analysis of urban land use change using sequential aerial photographs and SPOT data: An example of north Bhubnaswar, Orissa. Journal of Indian Society of Remote Sensing. 22(5):225-235.
16. Prodanovic P and Simonovic SP (2007) Impacts of changing climatic conditions in the Upper Thames River basin. Can. Water Resour. J. 32:265–284.
17. Rawat Pradeep K and Pant CC (2007) Geohydrology of Dabka watershed, using remote sensing and GIS. in Management Strategy for the Indian Himalayan Development and Conservation , Eds., Rawat M.M.S and Pratap. 161-183.
18. Rawat Pradeep K, Tiwari PC, Pant CC, Sharama AK, Pant PD (2010) Modeling of Stream Runoff and Sediment output for erosion hazard assessment in Lesser Himalaya; Need for sustainable land use plane using Remote Sensing and GIS: A case study International journal of Natural Hazards, Accepted and in press.
19. Rawat Pradeep K, Tiwari PC, Pant CC, Sharama AK, Pant PD (2011) Spatial variability assessment of river-line floods and flash floods in Himalaya: A case study using GIS. International journal of Disaster Prevention and Management. Accepted and in press.
20. Roy L, Leconte R, Brissette FP, and Marche C (2001) The impact of climate change on seasonal floods of a southern Quebec River Basin. Hydrol. Proc. 15:3167-3179.
21. Sharma, VVLN, Krishna GM, Malini B, and Rao KN (2001) Land use/land cover change detection through Remote Sensing and its climate implication in the Godavari delta region Journal of Indian Society of Remote Sensing. 29 (1and 2):85-91.
22. Slobodan P and Simonovic (2010) A new methodology for the assessment of climate change impacts on a watershed scale. Current Science. 98(8):1047-55
23. Tiwari P C (1995) Natural Resources and Sustainable Development in Himalaya. Shree Almora Book Depot, Almora.
24. Tiwari PC and Joshi B (1997) Wildlife in the Himalayan Foothills: Conservation and Management, Indus Publishing Company, New Delhi.
25. Tiwari PC (2000) Land Use Changes in Himalaya and their Impact on the Plains Ecosystem: a. Need for Sustainable Land Use. Land Use Policy. 17:101-111.
26. Tiwari PC and Joshi B (2002) Integrated Resource Management in Forestry Using Remote Sensing and GIS, in Forest History of the Mountain Regions of the World Eds., Rawat A. S: 242-258
27. Tiwari PC and Joshi B (2005) Environmental Changes and Status of Water Resources in Kumaon Himalaya. In Sustainable Management of Headwater Resources: Research from Africa and Asia, Eds., Jansky Libor et al.: 109-123.
28. Scheling D (1988) Flooding and Road Destruction in Eastern Nepal [Sun-Koshi]. Mountain Research and Development 8:78- 79.
29. Sharma KP, Adhikari NR, Ghimire PK and Chapagian PS (2003) GIS based flood risk zoning of the Khando river basin in the tarrai region of East Nepal. Himalayan Journal of Science.1(2):103-106.
30. Sing SK (2006) Spatial variability in erosion in the Brahmaputra basin: causes and impacts. Current Science. 90(12):72-1276.
31. Valdiya KS and Bartarya SK (1989) Problem of mass-movement in part of Kmaun Himalaya Current Science.58:486- 491.
|
 IJCRR
IJCRR 


 This work is licensed under a Creative Commons Attribution-NonCommercial 4.0 International License


