IJCRR - 3(11), November, 2011
Pages: 36-40
Print Article
Download XML Download PDF
SOLAR CONSTANT, SUNSPOTS AND SOLAR ACTIVITY
Author: R.Sumathi, R. Samuel Selvaraj
Category: General Sciences
Abstract:This paper deals with study of sunspot numbers and solar energy since 1755.
Number of sunspots and solar energy varies for each solar cycle. The duration of solar cycle is
from 9 to 11 years. It varies every time. Solar cycle is the time interval from a sunspot minimum
to the next sunspot minimum.
Keywords: Solar Constant, Sunspot Number and Solar activity
Full Text:
INTRODUCTION
Solar constant is an average quantity of solar energy at normal incidence received by the earth‘s atmosphere from the sun. It is about2 calories per minute incident on each square centimeter of the upper atmosphere. The actual value of the energy varies with several factors. The most important factor is the earth‘s distance from the Sun which changes from surface to surface because of the earth‘s elliptical orbit. For computing the value of solar constant, astronomical unit or average earth-sun distance is used. In space, solar radiation is practically constant; on earth it varies with the time of day and year as well as with the latitude and weather. The maximum value on earth is between 0.8 and 1.0 kW / m². The average annual amount of isolation varies between 950 and 1100 kWh / m², depending on the region. The solar constant includes all types of solar radiation, not just the visible light. It is measured by satellite to be roughly 1,366 watts per square meter (W/m²).The actual direct solar irradiance at the top of the atmosphere fluctuates by about 6.9% during a year (from 1,412 W/m² in early January to 1,321 W/m² in early July). When solar irradiance is measured on the outer surface of Earth's atmosphere, the measurements can be adjusted using the inverse square law to infer the magnitude of solar irradiance at one AU and deduce the solar constant. varying distance from the Sun, and typically by much less than one part per thousand from day to day. Thus, for the whole Earth (which has a cross section of 127,400,000 km²), the power is 1.740×10¹⁷ W, plus or minus 3.5%. The solar constant does not remain constant over long periods of time but over a year varies much less than the variation of direct solar irradiance at the top of the atmosphere arising from the ellipticity of the Earth's SOLAR CONSTANT, SUNSPOTS AND SOLAR ACTIVITY R.Sumathi¹, R. Samuel Selvaraj² ¹ Department of Physics, Quaid-E-Millath government college (W), Chennai Tamil Nadu. ²Department of Physics, Presidency College, Chennai, Tamil Nadu E-mail of Corresponding Author: sumathigopal64@yahoo.co.in 37 International Journal of Current Research and Review www.ijcrr.com Vol. 03 issue 11 November 2011 orbit. The approximate average value cited 1,366 W/m², is equivalent to 1.96 calories per minute per square centimeter, or 1.96 langleys (Ly) per minute. The sunspots vary in number, size, and duration . There may be¹ up to 20 or 30 spots at any one time .The sunspot may be in size between 1000 and 2000 km diameter with a life cycle from hours to months. Each sunspots consists of two regions a dark central portion of sun spot is umbra at a temperature of around 4000°c and a surrounding lighter portion of sun spot is penumbra at a temperature of about 5000°c .
The average number of spots and their mean area fluctuate over time with a mean period of about 11.3 years. As the sunspot cycle develops the older spots fade away and new more numerous spots appear at lower latitudes. Sunspots activity has been measured by using the wolf num ber for aboutn300 years. This index (also known as the Zurich number) uses both the number of sunspots and the number of groups of sunspots to compensate for variations in measurement. A 2003 study by IIya Usoskin found that sunspots had been more frequent since the 1940s than in the previous 1150 years.² Relationships between sunspots and solar luminosity are to know to exist since the historical sunspots area record began in the 17th century 7. The correlations are now known to exist with decreases on luminosity caused by sunspots (generally <0.3%) and increases (generally < + 0.05%) caused both by facule that are associated with active region as well as the magnetically active ?bright net Work³. Variations in the solar diameter might cause variations in output, but recent work, from Michelson Doppler Imager instrument on SOHO, shows these changes to be small, about 0.001%. The rise and fall of solar activity follows an approximately 11 year cycle. The solar activity is composed of sunspots, flares and coronal mass ejection.
MATERIALS AND METHODS
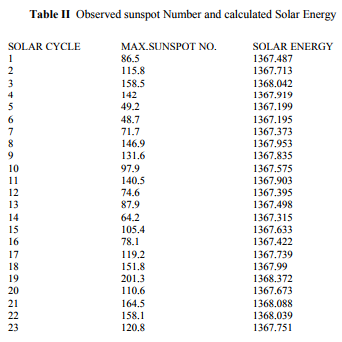
Data for each solar cycle, its period and maximum number of sunspots in each cycles have been taken from http://www.ngdc.noaa.gov/stp/solar/SSN/sss .html. Using the data ,calculated the total radiance from the sun varies with sunspot number using the relationship: E=1366.82+(7.71x10‾³x R) W/m² (1)
Where E is the solar energy reaching the Earth and R is the number of sunspots.
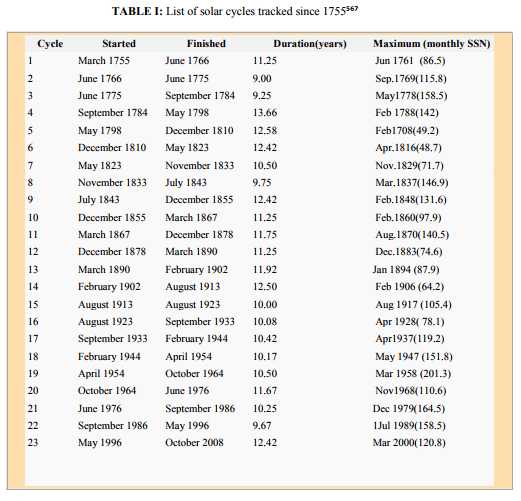
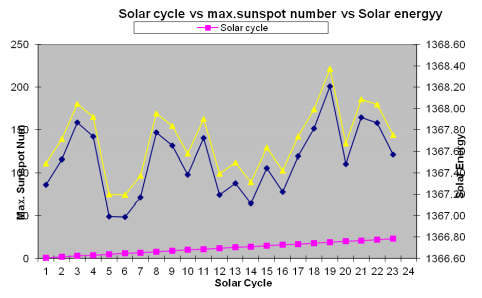
Observation are recorded in a graph with solar cycle(X-axis),SSN,Solar energy(Yaxis). Solar cycle and maximum sunspot number are given Table I. From March 1755 to October 2008 there were 23 solar cycles.
The time interval from a sunspot minimum to the next sunspot minimum is called a solar cycle. The period from 1755 to 1766 has been chosen as solar cycle 1. So far, we have 23 solar cycles.
The features of solar cycles are given in the table 1.
For the maximum sunspot number the corresponding solar energy was calculated using Eq.(1) and their values are given in Table 2.
RESULT
It is found that solar energy value varies with sunspot numbers. From the study of 23 solar cycle,19th cycle had maximum sunspots and corresponding solar energy is higher compared to other cycles. This study can be useful for climate analysis
. DISCUSSION The variation of solar energy in each cycle is less than 1% of the average solar energy for 23 solar cycles hence the variation is marginal. Though it seems marginal even a change of 0.5% in TSI can affect the earth‘s climate through following feedback mechanism.
1. Increased absorption of solar UV radiation by ozone in the stratosphere. 2. Reduction in the flux of galactic cosmic rays leading to less cloud condensation.
3. Changes in electric field of ionosphere resulting in the corresponding changes in the electric charges of clouds.
References:
1. Burrogh ?Extraterrestrial influences?, Cambridge,(121
2. Usoskin,Ilya G,solanki,SamiK, Schtissler,Manfred,Mursula,Kalevi,Alan ko,Katja(2003),?AMillennium Scale Sunspot Number Reconstruction.
3. Willson RC Gulkis s.Janssen M.Hudon H.S. Chapman GA (February 1981),Observations of solar irrandiance Variability, Science 211 (4483) 700-2 doi:10.1126/science 211448.700PMID 17776650
4. Burrogh, Weather cycles real or imaginary, Cambridge,141(1992).
5. Kanw, R.P. (2002), ?Some Implications using the Group sunspot number Reconstruction? Solar physics 205(2).384-401
6. ?Did you say the Sun has Spots??. Space Today Online. 7. Philips A. (2008),:Solar cycle 24 Begins?. Science @NASA
|
 IJCRR
IJCRR 


 This work is licensed under a Creative Commons Attribution-NonCommercial 4.0 International License


